


Open Source Data Observability Tools: 7 Popular Picks in 2024
Share this article
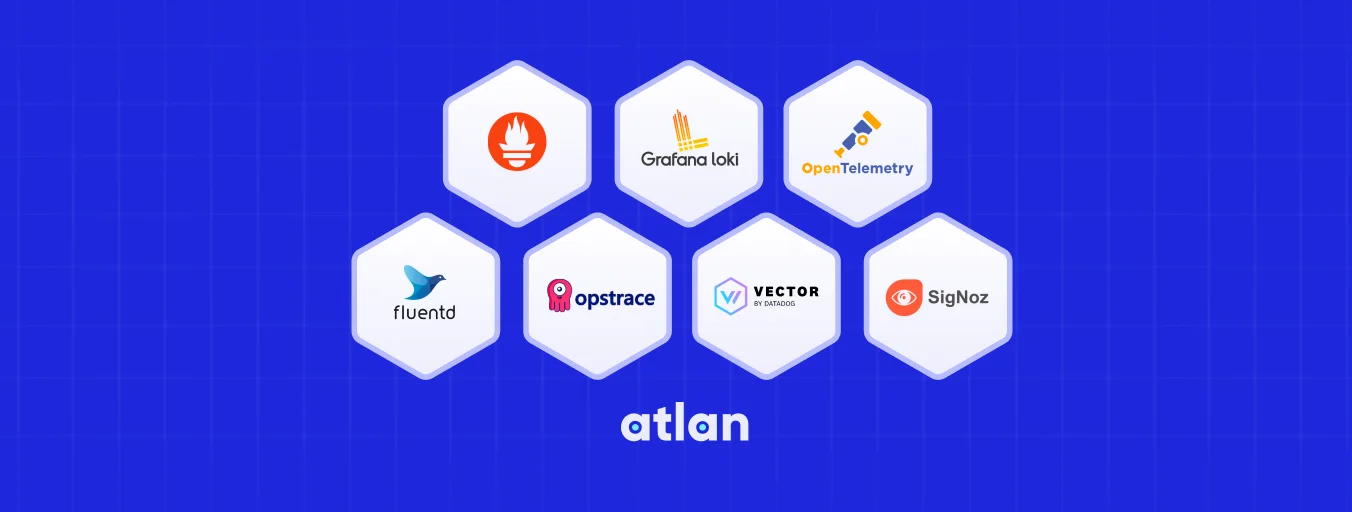
Here are 7 popular open-source data observability tools
- Prometheus
- Loki
- OpenTelemetry
- Fluentd
- Opstrace
- Vector
- SigNoz
Modern data problems require modern solutions - Try Atlan, the data catalog of choice for forward-looking data teams! 👉 Book your demo today
Data observability tools bring visibility into data systems. Using these tools, you can monitor and debug the operations and performance of your databases, data warehouses, data lakes, and data pipelines.
A single open-source data observability tool usually doesn’t have all the features required to enable complete visibility into your data systems. Some tools are helpful for log and metric collection, while others specialize in log and event tracing; some are good at visualization, while others are good for efficiently storing event and metrics data. You usually have to use a few of these tools in confluence to get that visibility.
This article will walk you through some of the significant event tracing and collection tools that you can integrate with your data stack. Let’s understand each of their capabilities in detail.
Prometheus
Prometheus Overview
In 2012, SoundCloud built a metrics collection tool, Prometheus, with a built-in time-series database. In 2016, SoundCloud handed it over to Cloud Native Computing Foundation for further maintenance.
Prometheus uses pull-based data collection by default. However, it can also push data into Prometheus using the Pushgateway. Using labels, Prometheus supports multi-dimensional data collection and stores it as key-value pairs in the time-series database.
Prometheus integrates with many popular databases, message brokers, HTTP servers, APIs, log aggregators, etc. With Prometheus, basic visualization is available with the Expression browser integrated with Prometheus, but you might find tools like Grafana more helpful for any advanced use cases.
Prometheus Features
By default, the Prometheus server stores the data on your local disk. However, you can also opt for external storage systems. The storage system has crash safety built into it. Prometheus stores the data in two-hour blocks backed by a write-ahead log (WAL), similar to PostgreSQL. It keeps the WAL files in even smaller chunks of 128MB, which you can replay in case of a crash.
Although Prometheus doesn’t support distributed storage or replication, you can make your storage highly reliable and available by taking timely snapshots and backups. If you’re unsure how your storage requirements will change over time, you can opt for a cloud-based managed deployment of Prometheus. All the major cloud platforms, including AWS, Azure, and Google Cloud, offer a managed service for Prometheus.
Prometheus has a few official client libraries for Go, Java, Scala, Python, Ruby, and Rust. Many unofficial client libraries are available for integrating with any other programming language.
Prometheus Resources
Documentation | Slack | Blog | GitHub
Data teams around the world use Atlan to bring their data to life
Join us on Wednesdays, 1:OO PM ET
Loki
Loki Overview
Grafana markets Loki as Prometheus, but for logs. One of Loki’s major features is its ability to order logs by time to enable faster search. The search feature is helpful for visualization, log aggregation, and tracing. Teams at Apple, Etsy, MathWorks, Datavisor, and others use Loki for log aggregation.
To ensure excellent search performance, Loki only indexes log metadata. It doesn’t create full-text indexes for the data. The log data is stored in compressed chunks locally on disk or remote storage systems like Amazon S3 or Google Cloud Storage. Loki accesses the compressed data based on your search queries through the indexes.
Loki Features
One key difference between Loki and Prometheus is that Loki focuses on pushing the logs instead of pulling metrics from different servers. Similar to Prometheus, Loki also offers native support for Grafana for seamless integration.
Data engineers and developers need logs to be stored for extended periods to ensure that they can debug issues even if they catch the bugs late. Some pieces of work in data engineering, such as executing complex Spark jobs, can generate quite verbose logs. They can use Loki with a cloud-storage account that would give them access to very cheap long-term storage, such as S3 Glacier.
The service discovery mechanism in Loki remains the same as in Prometheus. It is responsible for discovering targets, attaching labels to log streams, and finally pushing them to the Loki instance. Loki uses a Promtail agent to ship the logs from your local server to a Loki instance.
For working with logs, Loki provides a compelling use case in the PLG (Promtail, Loki, Grafana) stack, which you can use in place of the widely used ELK (Elastic, Logstash, Kibana) stack.
Loki Resources
Documentation | Discussion Board | GitHub
Download ebook → Building a Business Case for DataOps
Download ebook
OpenTelemetry
OpenTelemetry Overview
OpenTelemetry is a product of the merger of two major open-source projects. Many senior engineers from Google, Lightstep, Microsoft, Uber, and others took initiative to create a single tool to bring together the distributed tracing and metrics features of OpenCensus and OpenTracing.
Getting started with OpenTelemetry is quick and easy. It provides automatic instrumentation packages that allow data engineers and developers to embed instrumentation into their applications.
OpenTelemetry Features
OpenTelemetry commits to a vendor-independent implementation of the data collection, processing, and publishing processes. This rids you from supporting and maintaining various observability data formats, such as Jaeger and Prometheus.
Data engineering systems often use many languages and frameworks, so managing telemetry data coming from all components is often a challenge. OpenTelemetry reduces application overhead as it enables you to use a standard specification for transporting telemetry data.
These qualities of OpenTelemetry make it an effective tool to have in your stack. For these reasons, SigNoz, the open-source APM, bases its telemetry and instrumentation data collection on OpenTelemetry. More about this later in the article.
OpenTelemetry Resources
Documentation | Blog | Slack | GitHub
Fluentd
Fluentd Overview
Fluentd is an open-source data collector meant for unified data collection and consumption. It was created by Treasure Data back in 2011 after one of its founders realized that a good chunk of time-series data was unused because there were no sound systems to collect it.
Fluentd helps solve this problem by unifying all logs in a recognizable data exchange and storage format called JSON. Fluentd enables you to decouple data sources from your backend systems with a consistent format across the system, reducing interdependencies.
Thousands of companies, including Microsoft, Atlassian, AWS, Nintendo, Line, and Twilio, use Fluentd to solve their data observability problems. According to the documentation, Fluentd’s largest deployment is where it has collected logs from over fifty thousand servers.
Fluentd Features
Fluentd follows a hub-and-spoke model, where it acts as the hub and the data sources as the spokes. You can ingest data into Fluentd from access logs, application logs, system logs, and databases. Using various tools, you can filter and route your observability events to target systems that would help you raise alerts, do analysis, and archive your data for further usage.
Fluentd Resources
Documentation | Blog | Google Group | GitHub
Opstrace
Opstrace Overview
Unlike other tools in our list, Opstrace is a full-fledged, cloud-based observability platform that you can install in your Google Cloud or AWS account. Opstrace works on top of the three other open-source tools, Prometheus, Loki, and Cortex.
In December 2021, GitLab acquired Opstrace to integrate into their DevOps platform. This acquisition will also come with some changes to Opstrace’s architecture. They are now developing another logging backend on top of ClickHouse. GitLab will remove the Loki backend for logging as Loki’s license doesn’t comply with their license model.
Opstrace Features
Opstrace makes it very easy to get started. You can get an Opstrace cluster up and running in minutes. It gets even easier if you already have Prometheus set up. To be able to send data from Prometheus to your Opstrace cluster, you only need to add a few lines to your Prometheus configuration file. This is especially useful when you reduce the load on your Prometheus instance.
Scaling observability can be a pain. Products like Thanos and Cortex have tried solving the issues with scaling Prometheus. Opstrace chose Cortex to provide high scalability, high availability, multi-tenancy, and long-term storage.
Opstrace is responsible for the automatic generation of TLS certificates and authenticating API endpoints for read and write paths. Opstrace secures your data coming in and going out of the cluster. This saves you quite a lot of time when you want to go to production.
Opstrace Resources
Documentation| GitLab | Slack | Roadmap
Vector
Vector Overview
Timber.io launched Vector in mid-2020 as a tool to help you build data pipelines for your logs and metrics. Vector enables you to collect, process, and deliver your data application’s spans, traces, logs, and metrics to a tool of your choice.
Several companies, including Atlassian, Fastly, Zendesk, Discord, and Comcast use Vector to make their observability platform more reliable, robust, and cost-effective. With Vector’s rising adoption, soon after its launch, DataDog acquired it in February 2021.
Vector Features
Vector takes a DAG-based approach to enable movement and transformation of data from one stage to another. Every DAG contains different components — sources, transforms, and sinks. Vector gives you an option to define your DAG using either a TOML, YAML, or JSON file. Vector uses Tokio to schedule the DAGs.
Vector defines any incoming metric or logs data as events. These events are then cleaned, enriched, and transformed. After the transformations, you can push these events into one or more sinks of your choice. You can send logs to AWS S3 for debugging and archival purposes. You can also feed these transformed events to Kafka, Loki, NewRelic, etc.
Vector uses a customized language for transforming observability data. Vector Remap Language (VRL) helps you to transform observability events and specify conditions for filtering and routing events further.
Vector Resources
GitHub | Releases | Documentation | Discord
SigNoz
SigNoz Overview
SigNoz aims to be an alternative to a full-scale application performance monitoring tool. It uses distributed tracing to enable you to create application and infrastructure metrics. It also gives you a detailed view of the traces to help you with the root cause analysis of any problem you might face.
SigNoz aims to provide a fully integrated view of your data application’s metrics and telemetry data in an integrated UI. This enables you to aggregate and filter over traces and perform an aggregation over other types of incoming logs.
SigNoz Features
SigNoz builds on top of OpenTelemetry. It stores the collected instrumentation data in a columnar format in ClickHouse and exposes it to a ReactJS and Typescript frontend. For long-term storage and analytics, you also can use Amazon S3 as the storage and ClickHouse.
Most data engineering applications use a variety of languages and frameworks, such as Python, NodeJS, Java, or Scala. Because it relies on OpenTelemetry, SigNoz makes it easy for you to add manual or automatic instrumentation to your application.
Another interesting feature that SigNoz is working on right now is the anomaly detection framework largely inspired by LinkedIn’s ThirdEye. This framework will enable you to have a better dynamic response and threshold capabilities for alerting.
SigNoz Resources
Documentation | Roadmap | Slack | GitHub
Other Tools
The data observability space is expanding and evolving very fast. All the good tools can’t be featured in one article. But we mention them here in this section because some of these tools are essential for a good data observability setup. Jaeger and Zipkin are two of the most critical distributed tracing tools. They work seamlessly with OpenTelemetry.
Although Opstrace went with Cortex for their integration, there’s an equally great open-source tool, Thanos, for providing you with a highly available Prometheus setup with long-term storage capabilities. Another such tool is Rsyslog, which you can use for log processing. You can think of it as an alternative to Fluentd or Logstash (of the ELK stack).
Conclusion
Setting up data observability is tricky. There are a lot of tools and components that you need to look at, especially if you have a multilingual architecture. The key here is to identify which tools complement each other and work well together.
Also, it’s worth noting that observability can cost you a lot. So, it would help if you analyzed these tools for their cost-effectiveness, both for processing the data and storing it. And finally, you have to consider the availability and maturity of certain non-negotiable features that you want in your data observability setup. Doing all these things will help you set up a good system for data observability.
Want to dig deeper into data observability?
Start with our explainer
Related deep dives on popular data tools
- 12 popular observability tools in 2024
- 5 popular open source data catalog tools to consider in 2024
- 5 popular open source data lineage tools in 2024
- 5 popular open source data orchestration tools in 2024
- 7 popular open-source data governance tools to consider in 2024
- 7 popular open-source ETL tools
- 11 top data masking tools
- 9 best data discovery tools
Photo by Olya Kobruseva
Share this article