
Three pieces in this newsletter got here before me. Jessica Talisman argued that our industry confused measurement with meaning. Prukalpa separated the context substrate into AI-ready data, semantics and ontology, and skills, and insisted context be built, tested, reviewed and versioned like software. Juha Korpela made the case that conceptual modeling, the discipline data teams abandoned during the Big Data era, is the one AI agents now need most.
I agree with all three. I want to add the least glamorous part of the story: the math.
The 200-millisecond problem
An employee asks a question. The answer is present somewhere within your organization. Spread across systems that were never designed to be read together. Your model will accept roughly 20,000 tokens of it. Your retrieval path has about 200-milliseconds to decide which twenty thousand.
This is a selection problem under two budgets at once, latency and cost. Bigger context windows, more embeddings, a cleverer system prompt: each answers a question sitting next to the real one. The real one is which twenty thousand tokens, in what order, and how fast.
Get the selection wrong and the model hallucinates confidently. Get it right and take four seconds, and nobody uses your product. Get it right, quickly, and expensively, and your CFO learns your name.
Biology settled this a long time ago. Your spinal cord does not consult all available sensory data before pulling your hand off a hot stove. The path is already there, laid down long before the moment it is needed. That is where the speed comes from: wiring built in advance.
Which brings us to graphs, and specifically to the graph as wiring inside a context layer rather than as the context layer itself.
Why a graph and not a really good search box
Vector search answers “what looks like this?” That is a useful question, and it is not the question your business runs on. Your business runs on “what is connected to this, and how, and who approved it, and what happened the last three times?” The first question returns things that resemble your query. The second returns things your query depends on, which is a different set and usually a much smaller one.
Structure is what lets you allocate the token budget deliberately. Run personalised PageRank, seeded on the entities in the question, and it ranks which of forty related records bear on this query rather than on the graph as a whole. Centrality tells you which definitions everything else depends on. You stop retrieving the top fifty similar chunks and hoping the useful one is not in the middle, and start retrieving a bounded subgraph: this decision, its precedents, its approvers, their immediate neighborhood. A bounded retrieval is a bounded token count, which is the whole game once cost and latency are the constraint.
That boundary is also the honest answer to context poisoning. When a model contradicts itself across two runs of the same question, the usual suspect is the embedding model. More often the retrieval had no principled edge, so a different set came back each time. Structure gives you a stopping rule.
One caveat about which graph, because Andrew Lentz drew this line here last week. His argument is that where you author context and what the agent queries at runtime are separate decisions, and that for bounded questions the agent needs definitions, join keys, grain and the governing rule rather than a graph to walk. I agree. Everything below is the authoring side: the structure you build upstream, and the artifact you distil out of it. The agent never touches it.
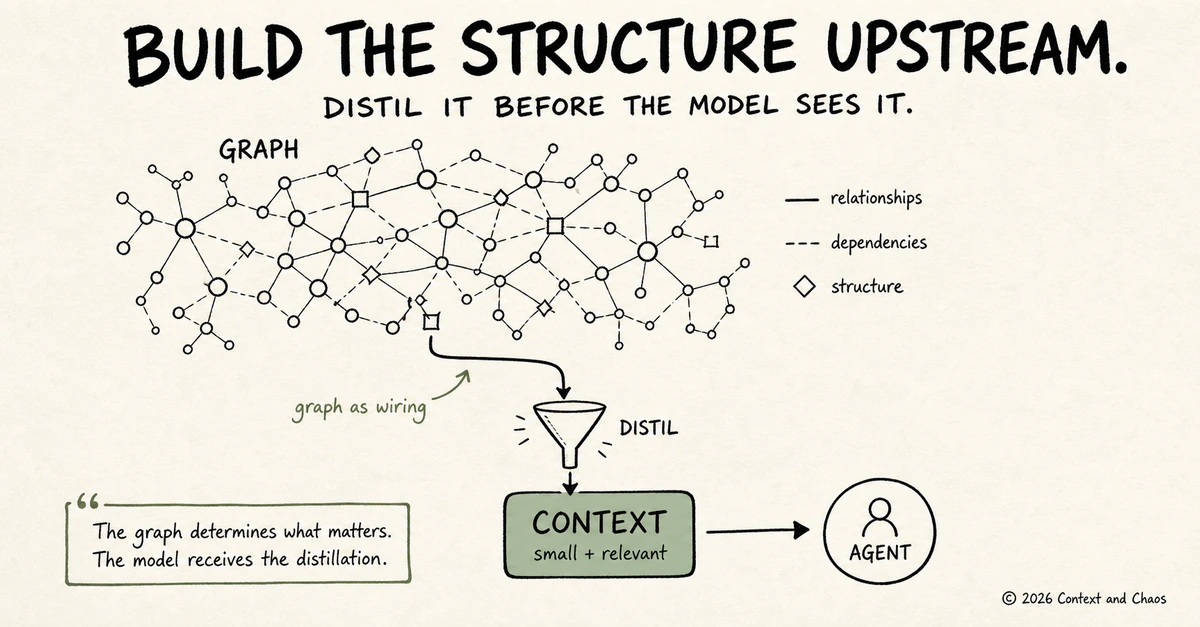
The graph is upstream wiring. The agent reads the distillation. | Source: Context and Chaos
The atomic unit is the decision trace
On that authoring side, the first question is what you model. Here is what I want to add to what Jessica, Prukalpa and Juha have already laid out on this matter. The unit worth modeling is the decision trace.
Not the document. Not the table. Not the metric definition. The trace: what happened, why, who approved it, which precedent justified it, and what was true at the time.
Your CRM knows the discount was 22 percent. It does not know that the VP approved it because the customer’s plant flooded, that three similar exceptions were granted in 2024, or that the approval happened in a hallway and was entered a week later by someone else. Your model needs the second thing to be useful.
Every real trace has four layers, and most systems capture none of them.
- Exception logic. The rule, and the conditions under which it was set aside. A policy document gives you the first half. Only the record of what was actually done gives you the second, and the second is what predicts next time.
- Historical precedent. The prior decisions that made this one defensible. Precedent turns a judgment call into a pattern, and it stays invisible unless decisions link to each other rather than filing separately.
- Cross-system synthesis. Most decisions draw on three or four systems with no shared key and no shared vocabulary. That synthesis happened in someone’s head, and the trace is the only place it was ever recorded.
- Out-of-band approval. The conversation that authorized the exception and never touched a system of record. This is where enterprises live, and it decides whether your agent understands the company or merely reads it.
This is also the structural reason the incumbent systems struggle. Warehouses sit on the read path after the fact. Agent platforms sit on the execution path without persistence. CRM and ERP are optimized for the transaction, not the trace. Each captures the what, and none captures the why. Prukalpa made the market version of this argument in January: in a heterogeneous enterprise the integrator wins over the vertical application. The architectural version is that the why has no owner yet, so whoever starts capturing it accumulates an asset nobody can buy later.
Why the structure does the work
Traces are worth capturing on their own merits. What makes them cheap to retrieve is how you shape them, and the compression that follows is a consequence of that shape rather than a general property of graphs. Three modeling choices decide it.
- Make the dependency graph acyclic. If every edge points from a concept to something it depends on, and no cycle exists, the retrieval question has a clean answer. Take the concepts a target depends on, directly and transitively. That set is the minimal context. A topological sort returns it in an order where nothing appears before what it rests on. Retrieval research has explored dependency DAGs and topological ordering as a way to cut tokens; what is underused is pointing it at enterprise context, where the dependency structure is what a decision trace encodes anyway. Andrew reached the same property from the cost side last week: a deep narrow acyclic graph is cheap to walk as far as you like, and a shallow dense cyclic one is ruinous by depth three. Cycles are the expensive thing, not depth.
- Type your edges and mean it.
PREREQUISITE_OF,DEPENDS_ONandPART_OFeach support a different traversal. A genericRELATED_TOcannot be traversed selectively, which quietly undoes everything above it. - Choose the right grain. In practice a domain resolves to somewhere between one hundred and six hundred core concepts, one classification each. Finer than that and the graph becomes noise. Coarser and the minimal context stops being minimal.
Get those three right and the retrieval question changes shape. You stop asking what is similar to this query and start asking what this concept depends on. The second question has a computable answer, and the answer is small.
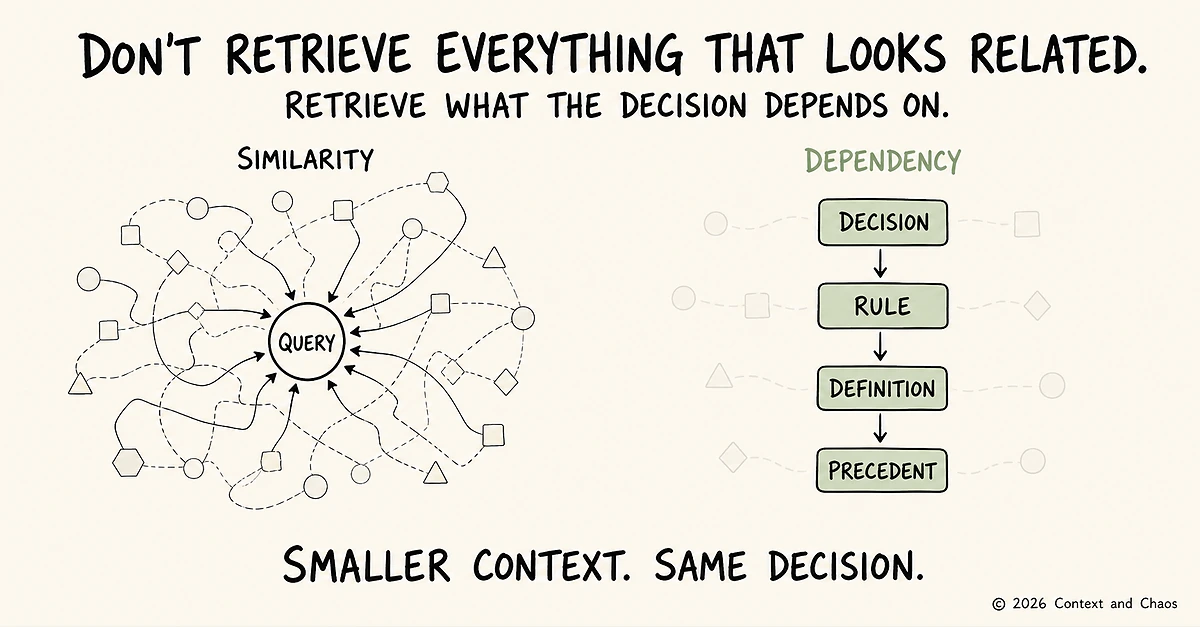
Smaller context. Same decision. | Source: Context and Chaos
What the numbers say
If context is a constrained resource, retrieval quality alone is the wrong objective. The objective is useful reasoning per token. We benchmark retrieval on recall and F1 and treat token cost as an afterthought, which is roughly like benchmarking cars on top speed and treating fuel as an afterthought. So the metric I have wanted for years is the Reasoning Density Score: F1 divided by tokens. Answer quality per token. Miles per gallon for context.
One result, from a benchmark I co-authored with Daniel Yarmoluk and which is still in preprint, so hold it loosely. A clinical trial corpus of 2.68 million tokens encoded as a compact knowledge graph of 2,614 tokens, roughly a thousandfold compression. To be precise about what that is: the graph does not hold the corpus. It holds the concepts, their dependencies and their classifications, which is what the questions in that domain actually turn on. Prose is discarded. At that size no current model holds the original corpus anyway, so the structure is what makes the question answerable at all.
The unglamorous plumbing
None of this requires new infrastructure, which is the encouraging part. A context graph is assembly work, the payoff for twenty years of data management that most organizations did halfway.
Semantic layers give you shared meaning over the lakehouse. Metadata management tells you what is trustworthy.
Metadata registries and ISO 11179 give you something more valuable than either: precise, non-circular definitions. A definition that does not refer to itself, does not smuggle in three undefined terms, and states its permissible values is the highest-compression token in the building. Most glossaries fail that test on the first entry.
Process mining, lineage and provenance reconstruct decision traces from event logs you already keep. Every workflow system, ticketing system and approval chain in your company emits the raw material. Almost nobody assembles it.
Bitemporal modeling separates when something was true from when you recorded it, which is how you answer “what did we believe on March 3rd.” That is the only question an auditor asks, and it is the question a model needs in order to reason about a decision made two quarters ago.
None of this is new, and that is the point. The wiring is mostly infrastructure you already paid for and never connected.
One caution, because it is the failure mode this newsletter has already documented. Prukalpa argued in February that semantic layers failed because they were abstractions built over ungoverned data. Graph structure imposed on ungoverned content reproduces that failure with better response times. The plumbing above is not preparation for the graph. It is the graph’s substance.
What it costs, and where this is not the answer
Assembly is still work. That compact graph cost about a tenth of a cent per query to consult, and considerably more than that to build: concept extraction, dependency modeling, expert review, and the ongoing cost of keeping it current. See our Benchmarking Token Costs Paper. Below the break-even you are paying for a structure you have not yet used, which is worth computing before you propose this to anyone.
Three cases where the structure does not pay.
Single-hop factual lookup. If the question is “what is the current list price,” dependency structure buys you nothing. Retrieval is fine, and cheaper.
Corpora without real dependency structure. Support tickets, customer conversations and news do not form a prerequisite lattice. Forcing one produces edges that mean nothing, and a graph whose edges mean nothing is a slower search index.
Content that churns faster than you can rebuild. If your concept set turns over monthly, the build cost never amortizes.
And one distinction, because it is where most graph projects go wrong. At a few thousand tokens the compact graph is a build artifact rather than a system: small, versioned, rebuilt on a schedule, and read by the retrieval path. It is not a second database, and nothing queries it at execution time.
The wiring
Everyone rents the same models. But it is very difficult to rent the record of why your company decided what it decided, and most organizations discard that record daily without noticing.
So start there, and start narrow. Take one decision your agents keep getting wrong, a pricing exception or an eligibility call or an approval, and write out what a complete trace of it would hold: the rule, the exception, the precedent, the person. Then check which of those four your systems actually store. It is usually one.
That gap is the work, and the asset. It compounds, and nobody can buy it.
Everyone else will keep asking larger models to guess, and will call the result an AI strategy right up until the budget review.
Measure the tokens.
A book from Dan
Dan McCreary writes free, open-source textbooks on building with LLMs, including Context Graph, and Token Efficiency. Both informed this piece. Please contact the author for a full biography of related interactive intelligent textbooks.
The Cats of Context & Chaos
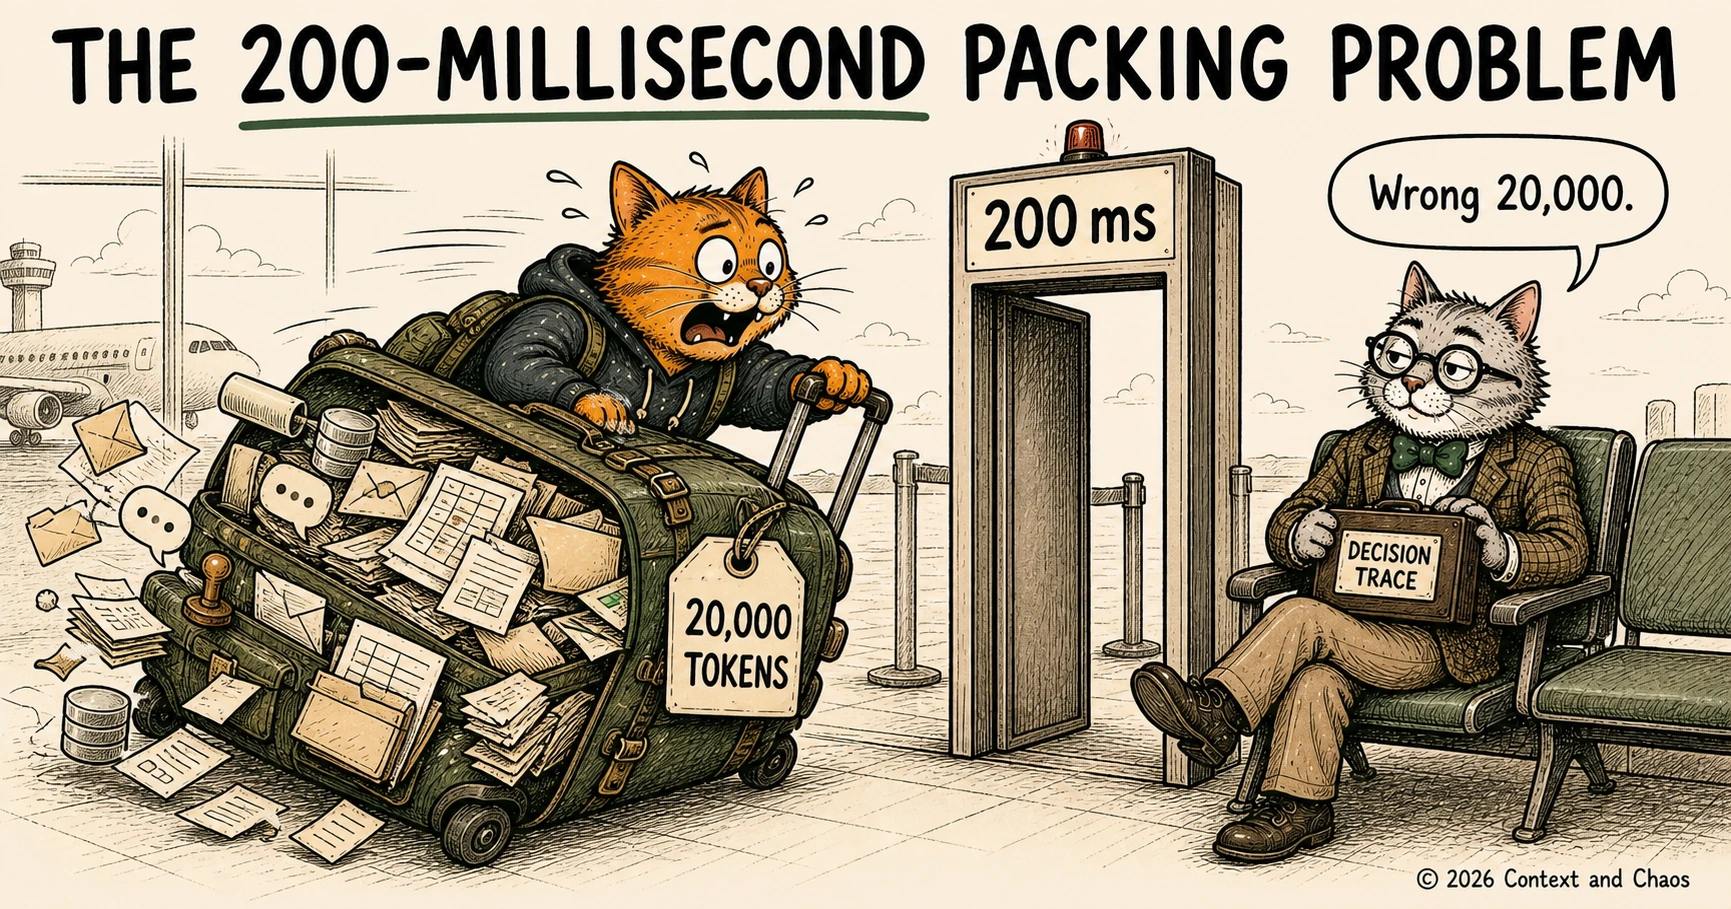
Wrong 20,000. | Source: Context and Chaos
About Context & Chaos
Context & Chaos isn’t just a newsletter. It’s shared community space where practitioners, builders, and thinkers come together to share stories, lessons, and ideas about what truly matters in the world of data and AI: context engineering, governance, architecture, discovery, and the human side of doing meaningful work.
Our goal is simple, to create a space that cuts through the noise and celebrates the people behind the amazing things that are happening in the data & AI domain.
Whether you’re solving messy problems, experimenting with AI, or figuring out how to make data more human, Context & Chaos is your place to learn, reflect, and connect.
Got something on your mind? We’d love to hear from you.
Share this article