
Everyone draws the same graph. The only real fight is about where it lives.
Ask anyone who has built enterprise systems how a project starts and you get the same answer. You put the people who actually know the business in a room, hand them a marker, and ask them to draw how it works.
They never draw tables. They draw circles joined by lines. A customer joined to an account, joined to a plan, joined to the policy that defines what a refund even is.
Emil Eifrem, CEO and co-founder of Neo4j, built a company on that observation. “We would just ask them to just draw your world on the whiteboard,” he says of the early consulting days, “and almost never did they end up drawing tables.”
What sent him looking for a different kind of database was the gap between the drawing and where the drawing had to go. He calls it an impedance mismatch: the whiteboard picture on one side, the relational schema on the other.
Two decades later, that same gap is the question sitting under enterprise AI. And most of the argument about it is happening on the wrong half.
Last month I spent an hour on it with Emil and with Prukalpa Sankar, chief editor of Context & Chaos. They agreed on more than I expected. Where they split is the one part that actually matters. Watch the discussion here.
The drawing and the place you keep it are two different decisions
Get this distinction straight. Most teams skip it, and it decides everything that comes after.
A model of your business, the concepts and how they connect, is one thing. The physical store you put it in is another. It can sit in memory, in files in cloud storage, as tables in the warehouse you already run, or in a database built specifically for connected data. Same drawing, four different homes, and the drawing itself does not care which you pick.
The words for the drawing are their own small war. Ontology, knowledge graph, context graph, each meaning something different depending on who is using it. Emil calls it ontology-washing, after cloud-washing, and it fits. We have sorted through those terms in earlier issues and are not relitigating them here.
After all of it, one point still stands, and it’s the last thing you’d expect from someone who’s spent years building graph databases:
Having a graph and running a graph database are not the same commitment.
That is Emil’s own position. A knowledge graph can live in memory, on disk, in object storage. Someone who has built a graph database product will tell you plainly that you can have the graph without buying the database.
Which sharpens the question rather than settling it. Given that your business is a graph, and it is, where should that graph physically live?
There is no single answer. There is an answer per workload, and it is less satisfying than the diagram anyone will sell you.
Three rungs, one customer
To find your per-workload answer, take one decision and keep raising the stakes until the architecture underneath has to change. We’ll stay with the same example the whole way up.
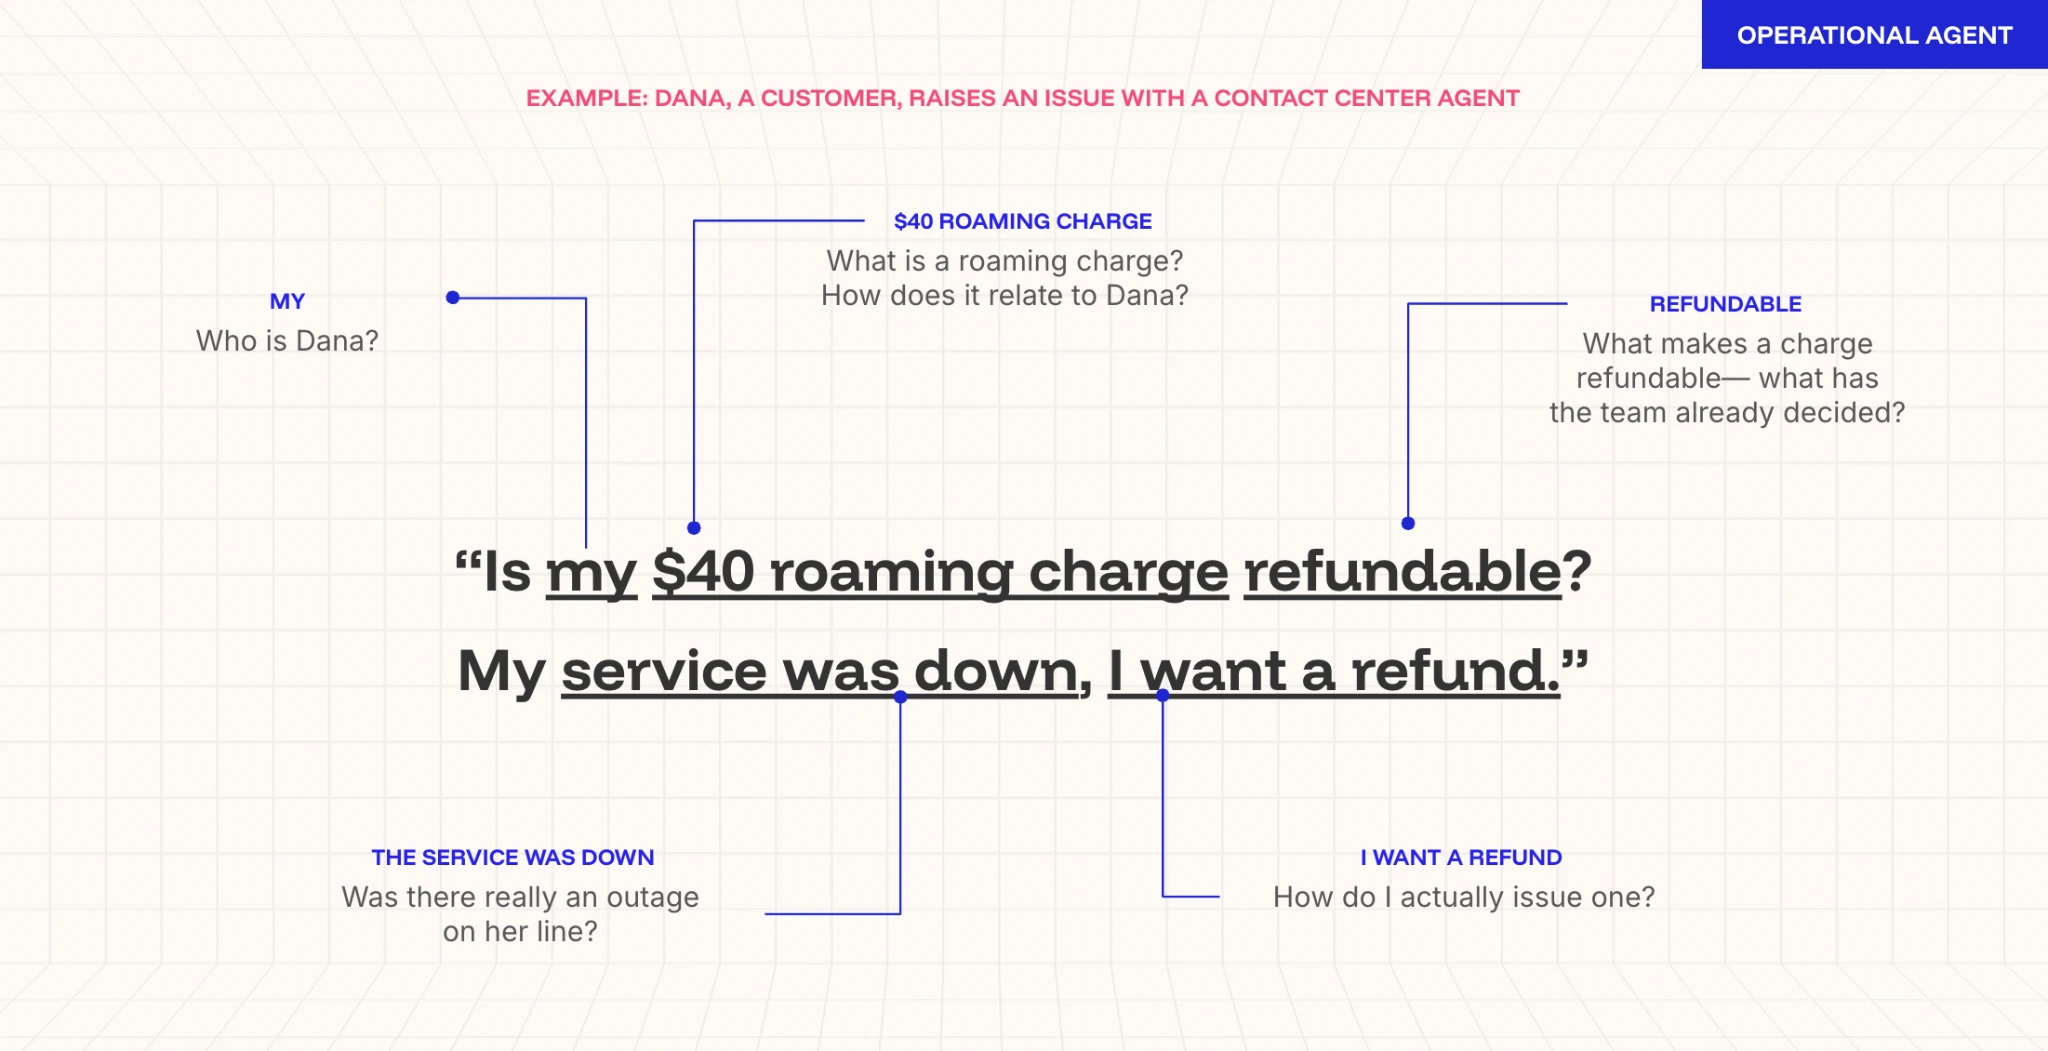
One ordinary question, and everything an agent has to know to answer it | Source: Context and Chaos
Rung one. Dana calls about a forty-dollar roaming charge she thinks she is owed back.
To answer, an agent needs the standard support picture: who Dana is, what her plan covers, the current refund policy, and any known outages on her line. You do need the business modeled. That does involve relationships, meaning and rules, and nobody in that conversation thought you could do it on loose documents and markdown files.
But look at the shape of the work. These are consistent, known queries. The same four or five joins, over and over, against a schema that is not moving. A relational database is probably fine.
This rung likely does not need a graph database.
Rung two. Dana was denied, and the denial was wrong.
The agent has an answer and the answer is no. Her plan ended on the 14th. The outage is logged on the 15th. Policy says no refund outside an active plan. Clean, defensible, but wrong. The outage actually started on the 13th, because the network event log and the billing system disagree about when an outage begins, and her plan end date was migrated incorrectly during a platform upgrade eighteen months ago.
A human overrides it, and Dana gets her refund.
The valuable thing that just happened was not the refund. It was the finding: that these two systems disagree about outage windows, that this class of plan carries a bad end date, and that in this situation the override is correct. If that lives in a ticket comment, the next agent re-litigates it from scratch next week. If it works its way back into context, every agent that hits the same discrepancy inherits the judgment.
So the question at rung two shifts from “what is true” to “what did we decide, why, and what does that change.” The decision, the reasoning, the two systems it reconciled, the policy it bent, the person who stood behind it, all connected to each other and to the records they came from. Here the relationships are worth more than the objects, and there is no version of this you can answer from the objects alone.
But that is a statement about the model, and not about the store. Rung two is genuinely “it depends,” and that is the part nobody wants to write down. It could be a graph database, which is exactly what the emerging idea of context graphs describes. It could equally be the relational store and warehouse you already run. Both answers ship, both answers are in production somewhere, and there is no matrix that will tell you which one is yours.
What it comes down to is empirical, and it looks like this:
- Accuracy, on your own evals. Does the agent get more answers right on your questions, against your data? That is the only number that settles anything.
- Maintainability, by hop count. Two or three joins is routine. Six is a conversation, and past some depth the query becomes something only its author can safely change.
- Latency. If a couple of seconds is fine, that is a much wider door than most architecture diagrams imply.
- Volatility. Fixed, known queries reward the store you already have; open-ended traversal, where you cannot predict the path, is where a second store starts to make sense.
- The cost of the copy. Not just money: pipeline, drift, two definitions of customer, someone on call for both.
Which makes rung two a hill-climbing problem rather than an architecture problem. You instrument the agent, you run the evals, you find the wall, and you move when you hit it. Anyone who tells you they know the answer for your rung two without having run it is guessing, and that includes everyone who was on that call, me included.
Rung three. The outage Dana called about is happening again right now, and it is not just Dana.
Something in the network breaks. A piece of equipment fails, or a contractor cuts a fiber line. Knowing what broke is the easy part; the monitoring system tells you that in seconds. The hard question is who is affected. Which towers went quiet. Which customers are on those towers right now. Which of them are businesses with contracts that start owing them money the moment service drops. And which are already calling in, so that whoever picks up already knows what happened.
Answering that means following the network outward from the break, and three things about it decide the architecture.
You do not know how far you have to look. From the broken equipment to an affected customer might be four steps or fifteen, depending on where the break happened and how traffic got rerouted twenty minutes ago. There is no fixed query to write in advance.
The break shapes the question, not you. This is the rung-two criterion inverted. At rung two the questions were stable enough that you could instrument them and decide. Here every failure is a different failure, and the path you have to walk changes with it.
And it has to answer while the phones ring. Every second of ambiguity is more inbound volume, worse routing, and contractual exposure nobody has counted yet.
Notice what happened to the network across these three rungs. At rung one it was a fact the agent looked up, any known outages on her line. At rung three it is a live graph being crossed under load. Same entity, completely different storage argument.
This is what a graph database is for. The network is not modeled as a graph as a design choice; it is a graph, and crossing it is the workload. You do not get here by bolting cleverness onto a warehouse. This maps to the distinction I started with:
When the relationships between things become more valuable than the objects themselves, you need the graph. When those relationships have to be traversed across many hops, and fast, under load, while someone waits, that is when you need the graph database.
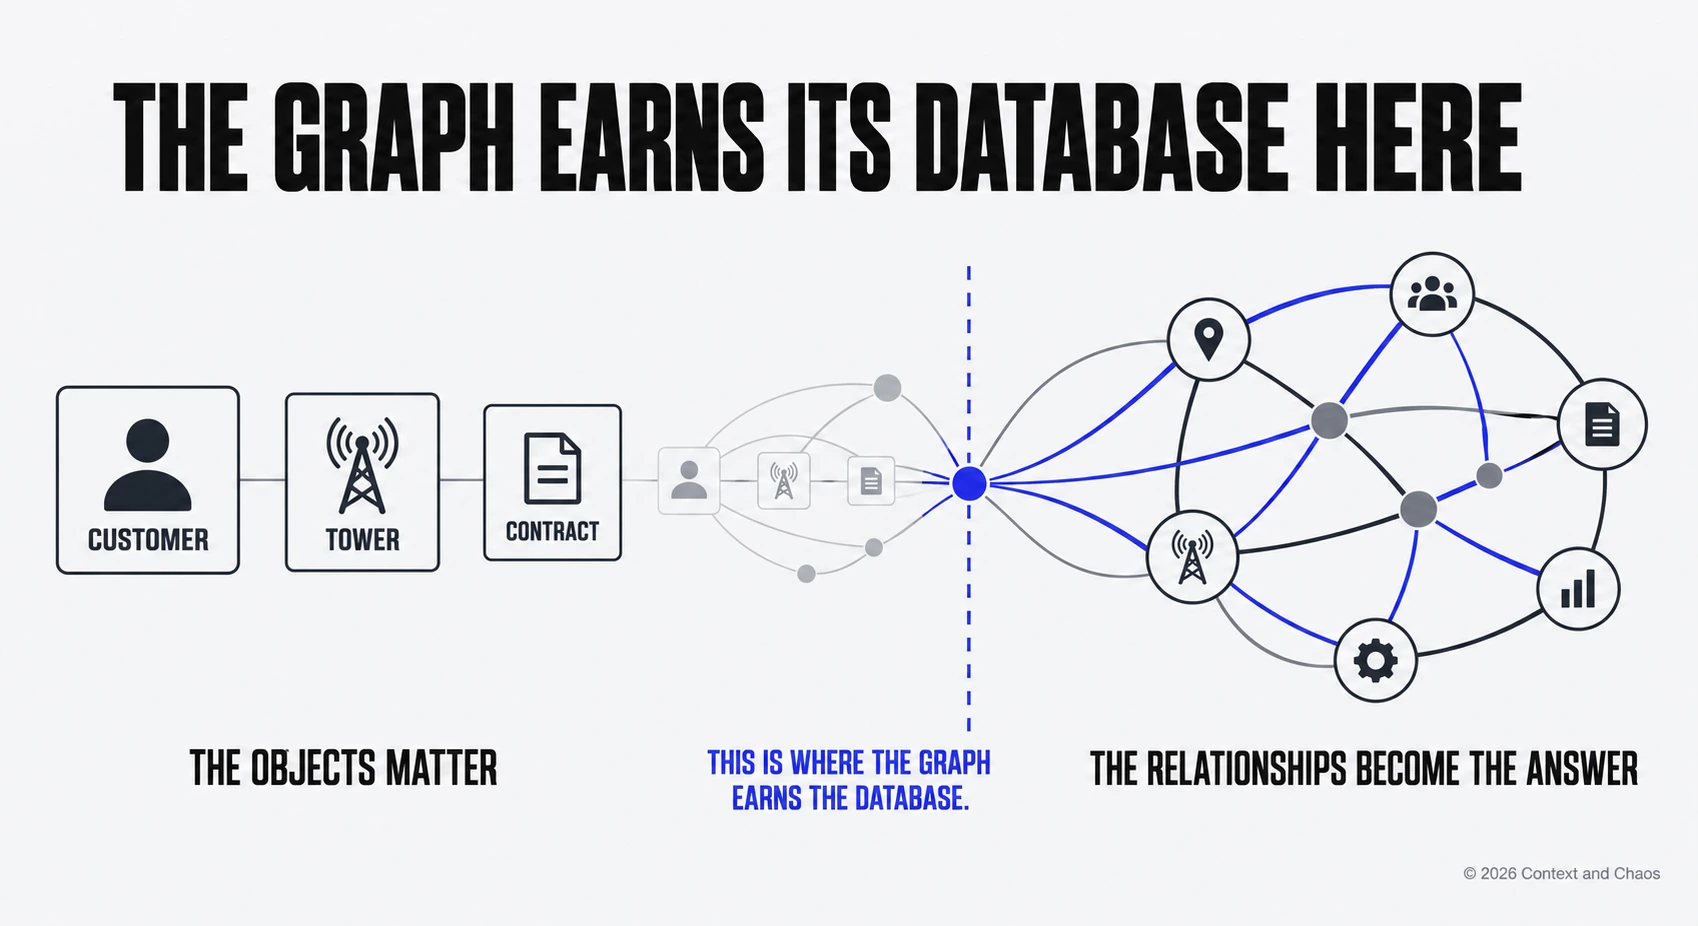
The threshold: when the relationships stop describing the objects and start carrying the answer | Source: Context and Chaos
Rung two is the first. Rung three is both.
Why this is a live decision only now
Graph databases and ontologies have both been around for decades. Both worked. Both stayed niche. The reason was cost, not capability.
Emil put the graph side plainly: “the earlier use cases that we won were the ones where we were truly antibiotics.” Antibiotics get prescribed for acute problems. Fraud rings, network topology, supply chains, recommendation engines. Cases where the connections were the product and nothing else would do. Nobody puts the whole population on antibiotics.
Ontologies have the same history. Prukalpa’s version:
Ontology “has existed for decades as a business problem,” with careers built on it, and “the challenge with it is it’s always been really hard to build and maintain. And so people would do it for these one-off use cases, or it had to be an important enough business problem to go invest.”
Palantir is the case in point. It deploys application by application rather than as a company-wide implementation, because modeling a whole business costs more than any single answer is worth.
Two costs set that price, and Emil named both: “How do I model my data as a graph?” and “How do I query?”
The query cost is largely gone. You just speak in natural language now. Cypher and GQL still exist underneath, but hiring for specialized skills isn’t needed.
The modeling cost is the one that moved further. An ontology can now be bootstrapped from the bottom up, out of the systems you already run. Point at a Postgres, a Snowflake, a Databricks, and the tables and the existing data model get read and turned into a proposed graph.
Emil is honest about the ceiling, “it’ll probably never get to 100% for all use cases,” and clear about what it buys: “it gets you out of this blank sheet of paper.”
The business layer bootstraps the same way, one level up. Stitch the estate together through end-to-end lineage, systems of record into the warehouse, warehouse into the business applications and the BI. From that you can reverse-construct the semantics, and the ontology from those. A draft derived from what the company already does, which a human corrects rather than authors. Emil’s name for the pattern is “bottom-up produced by AI meets top-down.”
Prukalpa named the failure mode most teams will hit first: “you and I can throw tables into Claude Code today and be like, can you create an ontology, and it’s going to create something that looks beautiful but it’s not going to be accurate.” Getting from beautiful to accurate is the work. Data quality principles from the pre-AI world, applied to context, in a pipeline. AI gets you past the blank page. It does not get you past owning the model, confirming it, and keeping it true as definitions drift and an acquisition arrives with its own idea of what a customer is.
That is the supply side. The demand side changed too.
A person using a dashboard brings their own context. They know which report is the real one. They remember the caveat from last quarter. They know the definition changed after the acquisition, and they know who to ask when a number looks wrong. None of that is in the data. It is in the person, and it got there over years. An agent has none of it and will not acquire it by working here for six years.
A dashboard also answers a question somebody anticipated. That is why pre-joined tables work. The question had a known shape, so someone modeled for it in advance. Agents get asked questions nobody anticipated, in language nobody standardized, and they have to assemble answers across things nobody pre-joined. Relationships stop being a modeling preference at that point and start carrying the answer.
So the decision is now in front of teams who never had to make it before. The price of entry collapsed at the same moment something arrived that needed this constantly rather than acutely.
Graph in the enterprise AI architecture
Let’s start with where graph comes up the vast majority of the time in agentic AI conversations, by Emil’s own count: GraphRAG.
You’ve heard of traditional RAG: chunk your unstructured content, embed it into a vector store, and at question time pull back the chunks sitting closest to the question so the model can answer grounded in them. Similarity search. Emil’s version of its limit is that vector search only ever tells you two things “scored 0.7 alike,” never why.
GraphRAG takes that and adds a concepts layer on top, connecting back to the actual chunks. Extract the entities and relationships out of the corpus first, so chunks that never resembled each other now share a node. Retrieval still starts with a similarity search to find an entry point, then follows the links outward, and material comes back because it connects to what you already found rather than because it reads like the question. You get multi-hop reach across documents, and a retrieval path you can inspect.
Retrieval techniques are constantly evolving. Every harness retrieves differently, and Prukalpa is blunt about where that leaves people: “skills retrieval is an open problem. Should you retrieve via graph, should you retrieve via keyword.” She expects all of it to change inside a year.
Graph shows up in a few other places in enterprise AI architecture conversations. They hold different things, they get written at different moments, and they are at very different stages of settledness. Most of the confusion in this market comes from arguing about one of them while pointing at another.
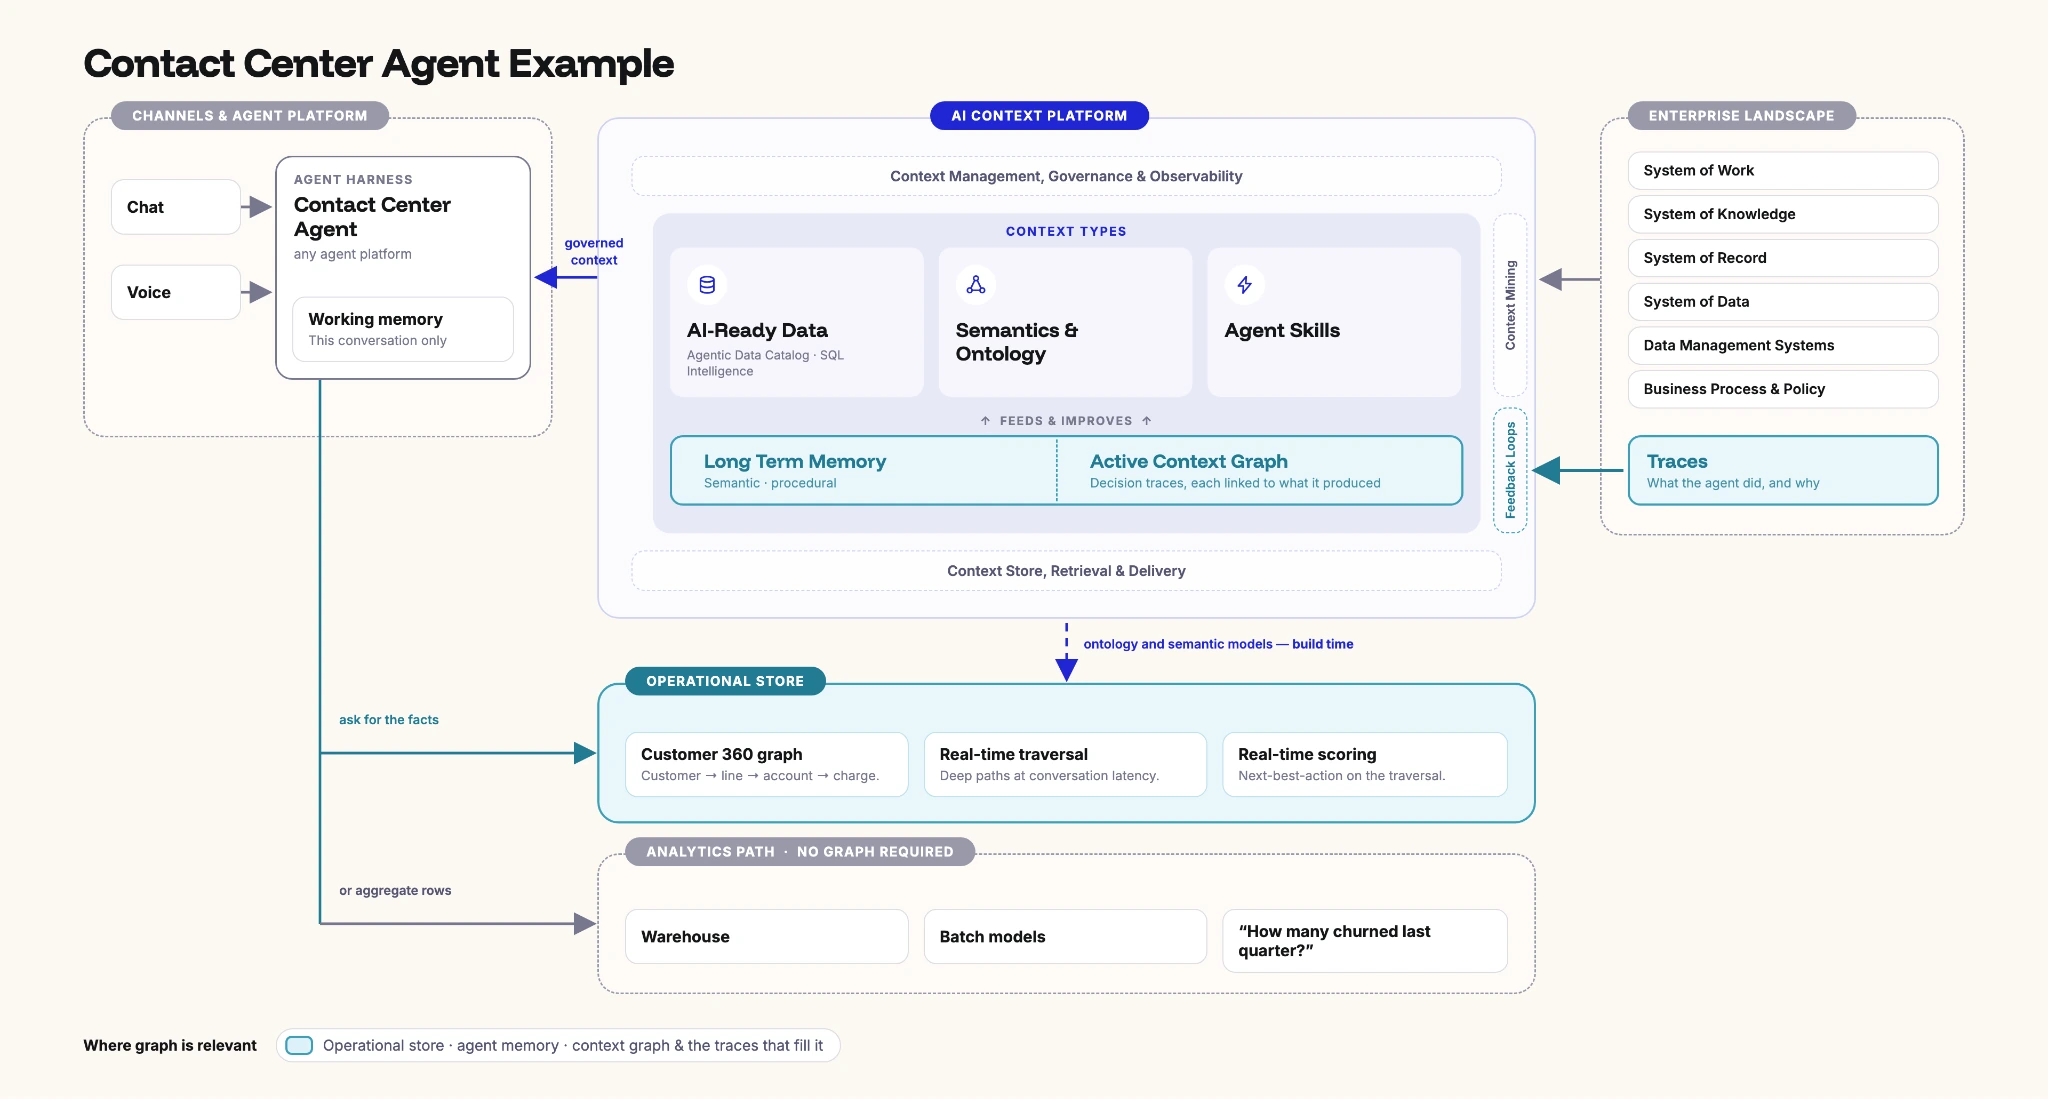
Where graph is relevant: the operational store, agent memory, and the context graph plus the traces that fill it | Source: Context and Chaos
1. The graph as the operational store.
The oldest job, and it has nothing to do with AI. The graph is the system of record for an entity and its connections. The customer 360 the business runs on, the network topology, the fraud ring, the supply chain. When something breaks and you need to know who is affected, this is what you ask. The traversal is deep, the answer has to arrive while people are waiting, and the break sets the shape of the question rather than you.
This is rung three, and it is settled. Graph databases have been bought for this since long before anyone said “agent.” The role has not changed. The number of workloads that qualify for it has.
2. The graph as agent memory.
What the agent has learned and can reuse. Semantic memory, procedural memory, the long-term store. This one arrived by convergence rather than design. “Memory is an intrinsically graph-centric workload,” Emil said, and his own note was that plenty of people have reached that conclusion independently, including people with no stake in graph databases at all. The initial MCP spec shipped a memory implementation and it happened to be a graph: “it’s a toy, it’s 500 lines of Python code, but it’s a graph.” A wave of agent-memory startups landed on the same structure without coordinating with each other.
It’s worth noting that memory has its own array of choices and methods as well. What you’d actually find in production could range from: no memory, markdown file wikis, rows in a table, vectors alongside the document store, or a graph. The honest note is that most systems mix two or three, which is truer than any single-choice framing.
3. The graph as part of the context platform.
The newest, and the one everyone is racing at. Emil gave it a better name in passing: “context graph,” he said, would more accurately have been a decision trace graph. That is most of what it holds. The principle here is that the agent can improve the most based on analysis of its traces and accumulated memories. Instrumenting traces and episodic memory are table stakes, but those are just logs providing no value if there is not a system converting them into things like skills or longer term procedural and semantic memory for future runs.
The agent leaves traces. “I walked this path to make a decision.” The context platform distills those traces into a reusable skill for future agent runs, which by Emil’s account has become the common pattern over the last six to nine months as skills took off. Memories and traces linked to a skill also allow for provenance. So when a new trace arrives that connects to an existing skill, it forces a decision: supersede that skill, retire it, or write a genuinely new one. A skill with no link back to what produced it is a snapshot with no expiry date, which is the same log-with-no-value problem one level up.
That is how the loop gets closed. It is the “why did we approve a refund like Dana’s last quarter” question, generalized.
What is not in question is that all three jobs have to get done. An AI context platform needs the operational state the business runs on, the memory of what its agents have learned, and the record of what got decided and why. That holds regardless of which store you keep each one in, and regardless of how the agent retrieves it. Storage and retrieval are choices you make per workload. The three jobs are not optional.
Start at the whiteboard
Draw the hardest decision one of your agents has to make. Not the easy one. The one with real consequences if it goes wrong. Then mark it up against four questions.
What does the agent have to do to decide, and how far does it have to travel to do it? What has to be explainable afterward: the data it used, the policy it applied, the approvals it leaned on? What are the real latency and scale limits, the ones the business will hold you to rather than the ones that sound impressive in a review? And what will change underneath it, so that a definition, a skill or a relationship can go stale without anyone noticing?
Then run the ladder twice, because there are two of them.
The first is the one I just walked, the business decision the agent supports. Look something up. Assemble evidence. Cross a live network on a clock. That ladder tells you where your operational data belongs.
The second is the agent’s own. What has it learned, where does that live, and how will you know when it has expired? Dana’s override is rung two of the first ladder and the whole of the second. Most teams run the first ladder and never run the second, which is how you end up with agents that answer well today and cannot tell you why they answered differently last quarter.
If the hardest thing your agents do is retrieve trusted facts and apply known rules, you may already have what you need, and a second system is a cost you have not justified. If they have to go deep and decide fast against data that resists being moved, that is where graph infrastructure earns its complexity, and refusing it is its own kind of expensive. And if you are on rung two, where most interesting work sits, the answer is that you have to go find out.
It took the industry the better part of two decades to internalize the split between the databases that run a business and the ones that analyze it, and then data volumes moved and even that had to be relearned. The line between which of these three jobs earns a store of its own will settle the same way. Early is not the same as wrong. It means the map is still being drawn.
Everyone draws the same graph. The only real fight is about where it lives. Answer that from the decision in front of you rather than the brochure, and the graph question stops being a religious war and becomes a routing choice you make one workload at a time.
One last thing, and it is the least glamorous advice anyone gave all hour. Prukalpa’s version was “build yourself personally.” That sounds like career advice, but it follows directly from everything above. There is no matrix that tells you rung two, and a simple use case can be dressed up to look like a graph problem by anyone with a slide. The only way to develop judgment about which architecture your agent actually needs is to run into the wall yourself, to instrument something, watch it fail, and be able to say precisely why you changed it. Because the agent got more answers right. Because it got to the decision faster. Not because it was on the diagram.
The Cats of Context & Chaos
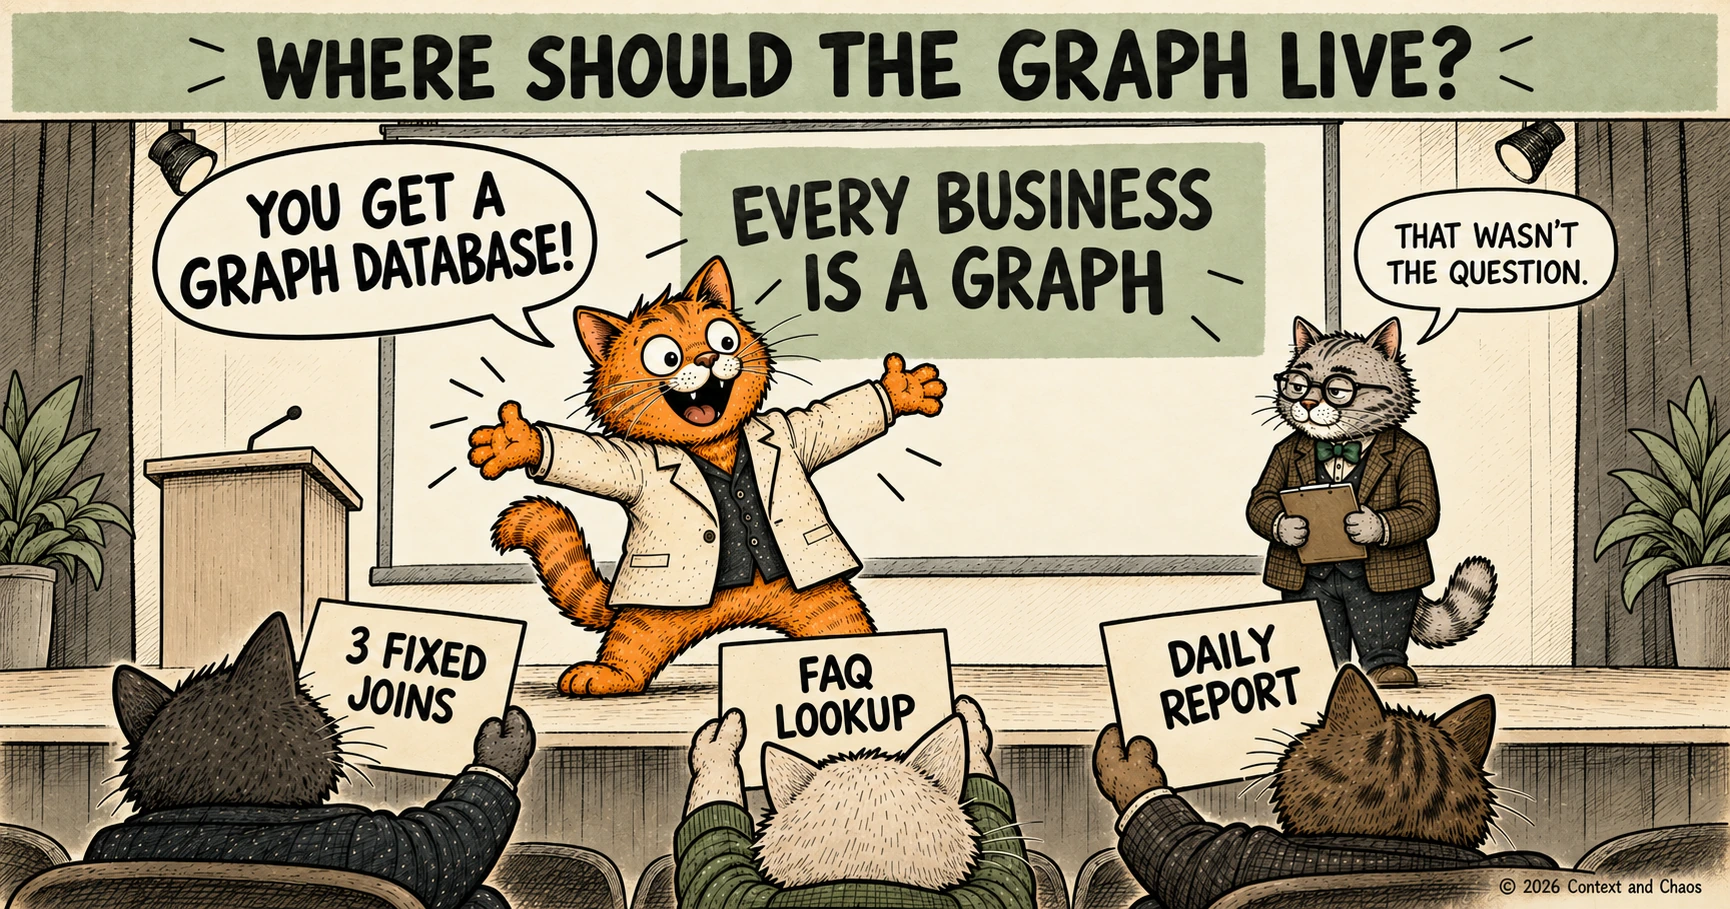
That wasn't the question. | Source: Context and Chaos
About Context & Chaos
Context & Chaos isn’t just a newsletter. It’s shared community space where practitioners, builders, and thinkers come together to share stories, lessons, and ideas about what truly matters in the world of data and AI: context engineering, governance, architecture, discovery, and the human side of doing meaningful work.
Our goal is simple, to create a space that cuts through the noise and celebrates the people behind the amazing things that are happening in the data & AI domain.
Whether you’re solving messy problems, experimenting with AI, or figuring out how to make data more human, Context & Chaos is your place to learn, reflect, and connect.
Got something on your mind? We’d love to hear from you.
Share this article