Full Platform Demo: Building Context for Your AI Agents
Live demos
Want to watch a live demo?
Atlan engineers bootstrap, test and deploy enterprise context on real data.
See it on your own data
Walk through how a context layer would work on your stack, with our team.
Talk to usAbout this session
41 min1 speaker
Frontier models get smarter every month, and they still don't know how your business defines revenue or which orders table is the trusted one. In this 41-minute session, Ryan connects Snowflake, dbt, and Sigma, lets context agents write the documentation nobody had time for, pulls certified metrics out of existing dashboards, and puts that context to work in Claude and Snowflake Intelligence.
Speakers
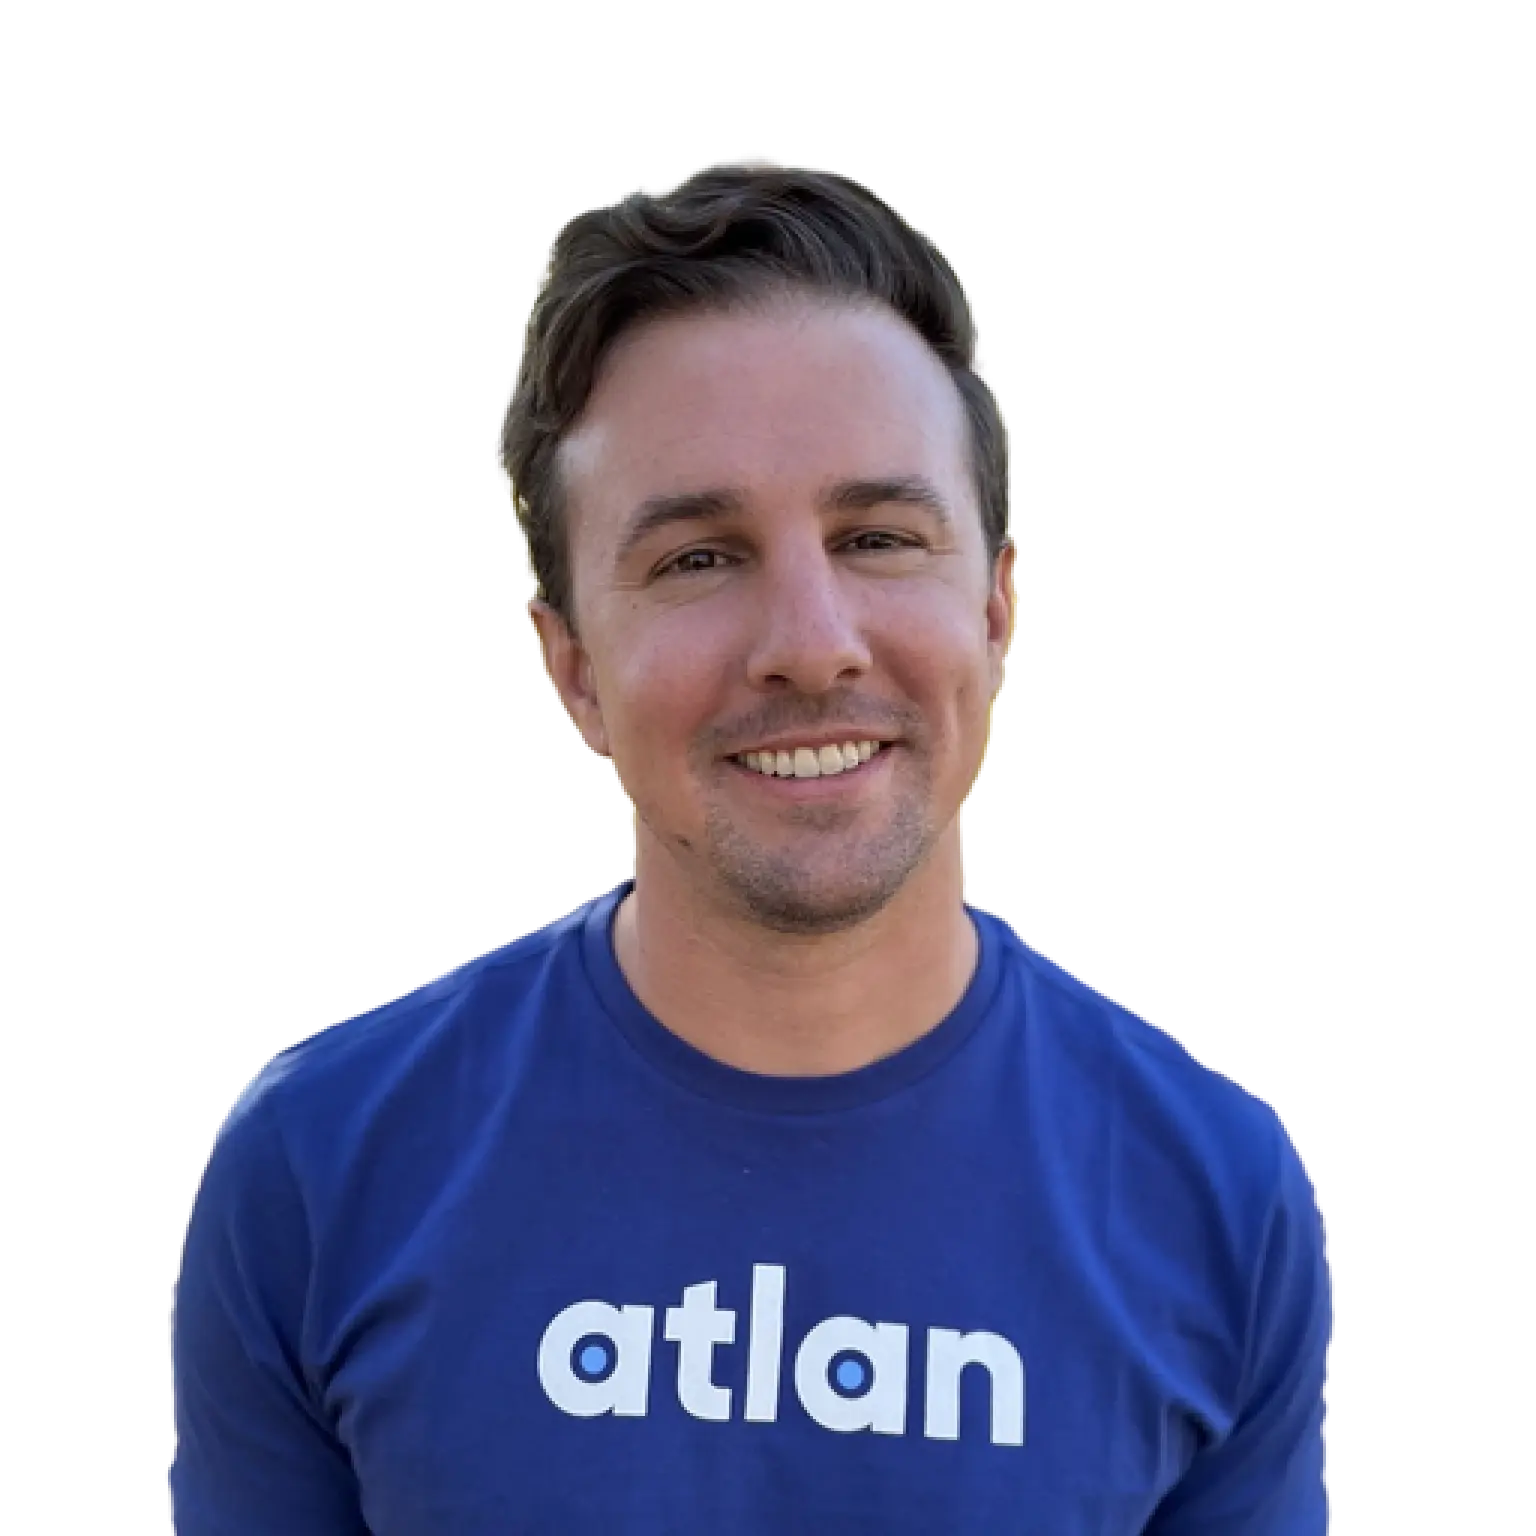 Ryan QuigleyStrategic Sales EngineerAtlan · Host
Full transcript6 chapters · searchable
Why AI needs a context layer
0:00Ryan Quigley
2:49 That I'll try and pick them up as I see them. If not, there'll be time at the end I can walk through individual questions and talk through some things that maybe I didn't cover along the way. So
3:02 Great. Let's get into it. So today we're talking about Atlan as the AI context platform. We're going to talk about what that means, how we connect concepts like ontologies, knowledge graph, semantic models, and help you activate the context that really gives agents and AI an understanding of how your business actually operates. So, a lot of great stuff to cover today. We'll kind of set the stage briefly and then spend a good amount of time in the platform itself walking through Atlan's capabilities. So we at Atlan, we work with a lot of customers on a broad spectrum of AI maturity. So many customers are still in the early days of understanding their data state. They have multiple warehouses, multiple BI tools.
3:51 They have the traditional data asset sprawl, and they're trying to help get some order to that chaos so they can help users and agents discover and trust that information. And so discovery mechanisms, lineage data quality, description, all that provides inputs to humans and agents to help find that information. Others have had that foundation in place. Maybe they have had a catalog in the past. They've had governance initiatives to do a lot of that heavy lifting, and they're looking to actually give agents and AI context about their business. So more than just pointing them at technical assets and saying, "Here's what's available," but starting to build out business meaning about how the business actually operates, building out data products, certifying metrics.
4:45 Further down the spectrum, as we start thinking about actually deploying agents into production, we end up with additional artifacts that are agent-specific. Skills being a very common industry pattern. They have the procedures that agents follow to get work done, the tools available via MCP. And then finally, as you start to scale agents across the platform, how do we then keep this context that we're curating and establishing fresh? How do we make improvements over time from the interactions we see from those human agent interactions? So we will walk through kind of a number of different topics along this spectrum here to show how we build through the various stages.
5:34 One thing we found over the last year or two in working with lots of customers on the ground trying to solve these problems, is that the performance that you want to actually get, increased accuracy, reliable answers, consistent answers, it can't come from intelligence alone. So yes, the frontier models are getting increasingly more and more capable. Seems like we have a new leap every month or even weeks these days. But that doesn't give An agent's understanding of your business. And so to actually drive performance, the outcomes that you want to be able to deliver on, the biggest lever we have is to build out this context layer, which has the knowledge, skills, and tools so that agents can understand your business and leverage the power of the intelligence effectively.
6:29 So one simple example of a common agent pattern we see is a talk-to-data analytics agent. When an executive asks a question like, "Why did refund rates spike in the North region this quarter?" While it seems simple, like a straightforward question, there's a lot of nuance there. Why questions are different than what we need to understand, the trend and the root cause analysis behind this, we need to understand the actual definition for refund rate according to this business, what counts and rolls up into the North region, and simple things like, what is your actual calendar year? You can't just assume that quarter means standard Q4, could be on a rolling basis depending on the business.
7:20 So to be able to support this kind of use case, we need to build a number of different components. So business semantics, the shared definitions that the business uses, like what actually is a refund, what constitutes that, how do we think about payments and regions, how do we define these metrics, verify them so that agents are not trying to invent this based on the technical metadata available. They have a defined, certified metric to leverage to pull this reliably. And also, generally, look what is available on the platform that is certified, what additional knowledge about the business can be encoded onto these assets themselves, so that should there be a data quality issue or a deprecation notice, that the agent and whoever's accessing, consuming this information knows that.
8:08 So ultimately, we're generating one trusted answer by building on top of all of this information.
8:17 So here's a high-level view of how we at Atlan approach that. And so this is an end-to-end context pipeline, and this will really be the blueprint for today's demo. It starts with connectivity into sources of information. So whereas it's like Snowflake, transactional systems like Postgres databases, business applications, BI layers, which have the business semantics and metrics encoded that the business is already consuming. These are all important sources of context that we need to bring into one unified layer that we can start building on top of. So we will construct this data graph that is bringing together lineage, query history, BI semantics, layering on top quality signals.
9:02 And then from there, we will leverage that foundation to run our internal context agents so that across your thousands and thousands of assets, this does not fall on a team of humans to bear this burden. Historically, on data stewards and governance teams, or even just data teams in general, all of that has landed on their plate, in addition to running analysis and insights for the rest of the business, and documentation context generation often falls by the wayside. So we set out to scale that with our agentic process to help curate and enrich context on top of that data graph.
9:47 And then once that's in place, we can start to layer on additional enrichment, and help curate and activate this context via a number of different interfaces, whether it's MCP into your favorite AI client like Claude or ChatGPT, SQL via the Atlan Lakehouse to run bulk access to content, generate completeness and metadata management like command centers, APIs for deterministic asset access, Python SDK for building out custom applications on top of this context. So as we build this all out, it is from the gate, from day one, available in our open metadata lakehouse or context lakehouse, which is built on Iceberg, and so this is open, portable, and can be delivered anywhere it needs to be accessed.
10:44 So if you're in Snowflake and you want access your context right alongside your data, you can do that day one from the Atlan Lakehouse. If you want to move off Atlan in the future, the context is yours. It is open and portable, and so we are helping curate and build on that, but activate it in any mechanism. We do not want you locked into any particular tool.
Connectors and column-level lineage
11:08Ryan Quigley
11:08 So with that, I'm actually going to jump into the platform. We'll kind of start left to right here. We'll move through data sources and kind of show what we get from our native connectivity into these systems, and then how our agents can run on top of that to build. So if we jump into Atlan proper, just to kind of orient everyone, this is my homepage. I can immediately go in and start searching and updating content and finding trusted information. But, that would be getting ahead of myself as much as I'd like to do that. We're going to start with our connector marketplace. And so this is where we connect into all the systems that I mentioned earlier. So where we're bringing in context from warehouses like Snowflake or Databricks, BigQuery, Fabric, you name it, BI tools like Power BI or Sigma, for example, with transformational layers in the middle, dbt, ingestion through Fivetran, you name it. Everything that you would need to bring context from your enterprise sources available here in our self-service app marketplace. And each one A very simple three-step process to get up and running.
12:19 Point out the source, tell us how to authenticate, filter the metadata you want to bring in. Maybe you don't want to bring in a number of raw databases that don't need to be curated. You have full control from day one to run this. We want it to be as easy as possible to get up and running, bringing in context, so we can focus on enriching, activating, and making these available for human and agent consumption. So, what we get as a result of this connectivity, and I'm going to go through an example of my favorite pipeline, which is Snowflake dbt Sigma, as an ex analytics engineer myself. So I'm going to walk through what we get out of the box from connectivity to native sources like that. So here, one particular node in that data graph that we're going to be able to construct is this fact orders gold layer table in Snowflake.
13:16 Out of the box in connecting to these sources via our App Marketplace, we will generate a catalog, like a complete inventory of assets, but also end-to-end lineage for these native connectors. So you can see here, we can immediately see downstream where this is feeding into the BI layers. We can see there's a transformation, a denormalization table that ultimately is powering Sigma assets downstream, and we can see a number of these are verified. Great trust signals just from a visual standpoint to understand what can be leveraged, what can be trusted, where there might be failures here. We see a data quality rule. We can touch on that later.
14:02 We also can go fully upstream to the transactional sources as well. So through the multiple hops, in the gold, silver, bronze layer back to transactional systems like SQL Server being replicated in via Fivetran or an adjacent Postgres table being copied out via an Airflow job, for example. So all out of the box via our native connectivity via our App Marketplace. And it doesn't just stop at the table level. So again, out of the box for these connectors is the ability to trace these fields at the column level to understand two primary use cases, one being impact analysis.
14:52 So if I need to change something upstream at source, and I need to quickly understand everything that would be impacted by this potential change on this column, we have immediate visibility into that. If we see an issue in the reporting layer in Sigma, for example, and we need to go triage how is a metric calculated, is unit price flowing into something like revenue, for example? We see in the consumption layer that there is an issue. We can immediately do root cause to understand this is feeding from this particular table. We can go check to see the dbt transformations that are on this table, for example, to see was there any recent change that may have impacted that model development. We can go all the way upstream to understand is this coming potentially from an issue at source.
15:47 And we can run data quality checks along the way to see and assess quality issues to hopefully get to the root cause as quick as possible. So again, out of the box from native connectivity is that foundation for building on top of. And so you can get this view from day or week one with Atlan. You have visibility into the data pipelines.
Context agents document the gold layer
16:14Ryan Quigley
16:14 However, often is the case, there's not documentation at source. So yes, we bring in this fact table. We have 10 columns here. None of them are documented. And as users and agents start to find this, they need to understand what is unit price here? How are we approaching quantity? How are these metrics defined? And not have to search through the code to identify that on every single field, because that ultimately will not scale. So we set out to build a process that could leverage all of this technical information encoded into these pipelines to bootstrap context and extract it out of the data pipelines themselves and bring them into the asset profiles and business glossaries so that as users come to discover this, everything is well documented and understood.
17:10 And so this is where Atlan developed our internal Agents Studio. So the Atlan Agents Studio is a suite of context agents that are running on your data state to reason and process all across all that technical information to generate descriptions, readmes, intelligence about how tables are related, so that we can help make sure these are well understood and trusted as we start to open it up for consumption. So the Agent Studio, the way that we approach it is we actually will, out of the box, generate a number of collections. So you'll see these at the top here, buckets of assets. And we're intentional in this way in that we didn't want customers to have to unleash agents across the entire data set. You might have millions of assets.
18:09 Some of them are likely going to be raw tables or intermediate tables that are not intended for downstream consumption. That's not where we should focus our effort. We want to Increase time to value or decrease time to value. Basically, it gets you to value as quickly as possible so that you can focus on the most important assets. So one very common collection is popular SQL assets. So these are the assets in the organization that are queried the most heavily. Great starting point to get enrichment up and running. And you can see here, we only have 44% coverage. We'll dive into what that means, but an indicator that we're lacking in this collection.
18:52 Other common ones are the gold layer that we just saw. So those facts and dimensions that are feeding directly into BI. Super important to have these well-documented and understood so that users can build off of them effectively. Agents can understand the quirks and pitfalls, potentially, on leveraging these tables. So let's jump into this gold layer collection and walk through what our agents will actually do. So we've identified a number of assets across the data estate that feed directly into BI. We have already run this collection before, so we have a decent level of description coverage from our agents, but we've had new assets come in, so it is not 100%. So if we wanted to enrich this now, these agents are going to leverage all of that information that we saw previously.
19:42 So the technical metadata that we can bring in from source, schema column names, data types, the lineage that we can connect, so we understand this is probably flowing from a Salesforce table upstream, or downstream it's feeding into executive reports. So query history, like common queries that are being executed against this, whether from the BI layer or analysts, for example. So great usage patterns to understand how is this table being leveraged. Any existing metadata as well. So if you have a business glossary that you import from day one with Atlan, we can also reference that information as well as additional grounded context for these agents as they start to generate column and table-level descriptions.
20:29 We'll also generate readmes on these assets and SQL intelligence. And so you can see here we're lacking on the SQL intelligence coverage, so we probably want to kick off an enrichment here to bring this up so this whole collection, a very critical collection, has very high coverage and enrichment. So what we get as a result of that, if we go back to our fact table, this is the complete asset profile for this Snowflake fact. We were previously looking at lineage. The context agents will generate this table description, all of the columns descriptions here as well. In this case, thank goodness this table only has 10. Very common for it to have 100. The agents will take all of that. They'll consider all of the column-level lineage and uses that we see to generate all of these descriptions in detail, so they're well understood.
21:26 In addition to a readme which can provide use cases, common questions that are being asked, like often the stakeholders and domain owners of these tables. We can scaffold all that out into the readme. I think one of the most important outputs from those agents is this query intelligence and usage intelligence tab. So this is where we start to build out the not just individual asset enrichment columns and descriptions, but how does this table fit into the broader data estate? How does it fit into other data pipelines that exist across the organization? We can use the query history and usage to understand the types of questions that users are asking, and these become critical downstream later as we start to think about building out eval sets or a set of queries that we want to run simulations against for agents.
22:25 We can take the existing usage patterns to bootstrap that information and say, based on what we see, we see that users are interested in understanding orders by customer with this particular grain. And so we can evaluate agents against that based on this information. So we're building that foundation. In addition to common joins and filters that are executed against this particular table.
Glossary and the metrics agent
23:01Ryan Quigley
23:01 So that was individual asset enrichment for a collection of assets. We focused on the gold layer. The Agent Studio also has a number of other dedicated agents that you can run. So we're going to touch on two of those here because I think they're critical inputs into building out the business semantics that help agents and humans understand your business. So one of those components is a dedicated agent or a custom agent template. So this is where we can hook into sources of unstructured information. Previously, we have been focused on data pipelines, the structured information moving from databases into the warehouse and downstream to the BI layer.
23:48 But there's likely going to be some critical information existing in sources like SharePoint or Confluence. Maybe you have some PDFs that are standard operating procedures that we want to follow, and there's critical knowledge encoded into those documents. This agent template can run and extract that information into our business glossary and generate a set of definitions that can first be previewed, but also then verified and promoted with a human on the loop. So this is one input for bringing in semantic information into Into the unified context layer. And once those definitions are in place, we can start establishing links to the physical assets themselves.
24:41 And so we'll see some of that here in a minute. One of the other agents available is our dedicated metric agent. So this is focused purely on extraction from the BI layer. Most companies have spent years now building out a suite of reports that drive the business, and a suite is probably too generous. Hundreds of reports that the business is looking at on a daily, weekly, monthly cadence to have insight into how the business operates. Often there's going to be conflicts across those as different teams build different metrics, and so you cannot just then point agents at that, whether the underlying tables or at the slap on a BI talk to data agent. First, we need to have visibility into everything that exists today and start governing and creating certified metrics in the platform. So our dedicated metric agent will do just that. And so we will create a new container for it.
25:52 We're going to point it at, in this case, I'll do Sigma and Tableau. So we'll select a number of reports here to bring in. We'll do executive sales monitor because that one's verified, and sales executive summary, another verified dashboard. And so we will point our agents at these assets that we've called in into Atlan via our native connectors. We'll bring that in, and so we'll start extracting the core KPIs, their dimensions, their grains, their filters, also identify potential variants by domain and possible conflicts. So I'm not going to kick off that generation.
26:35 We'll just go see the output because we've run this before. So what we get as a result of that metric agent run is a dedicated glossary of core metrics across a number of different domains or categories. Probably one of the most common metrics that we hear about, and I've experienced this myself in the past, is multiple definitions of revenue. Finance looks at it differently than sales. Marketing has a completely different view altogether. So we want to bring in and generate one canonical definition for revenue, or at the very least, identify that multiple versions should exist and have visibility into how those different versions relate to one another, what their differences are, and ultimately who owns them. So once these become extracted assets in Atlan, they are first class assets, they can be discovered, governed like anything else.
27:37 And so in this case, we've promoted this to verification. We've assigned owners and tagging, but also established a relationship amongst other terms in the metric glossary as well. And so this is where it moves from just a glossary, a collection of terms and definitions, to an actual business graph. And so total revenue is composed of net sales and discounts. It's related to units sold. And so we can start providing this map of how metrics relate to one another across the business. And so we start thinking about pointing an agent at your data state to do talk to data or agentic analytics.
28:25 This can be that starting point of finding certified metrics with the exact definition, but also the map for how to navigate to find other related metrics as user queries change, or if a user goes deep and runs a more complex analysis than just asking, "Hey, what's our revenue last quarter?" But it's not just connectivity to terms within the business graph. We want to be able to have this business graph actually connected to that data graph that we saw previously, the lineage, the pipelines, the relationships between those tables, and so as we extract this information, we also will establish the links to the physical data assets themselves, where a user would go to consume this data.
29:17 So, for example, total revenue exists in a flavor here in Power BI. So when users are in Power BI consuming this information, they can always bring up Atlan to understand, is this a verified metric? Possibly any data quality issues upstream. Who owns it if I need help? You name it. Similarly for any other connector or source within the platform. Here we see, going back to our earlier example, total revenue exists on this fact orders table. And we can always bring up the asset profile to get a complete picture of how this table should be used, what its current state is in terms of quality, freshness, and usage across the organization.
Context in Claude and Snowflake via MCP
30:14Ryan Quigley
30:14 So let me jump back to our initial blueprint here, what we talked about. So we've covered connectivity and sources. We showed how we can bring in end-to-end column-level lineage, how we leverage SQL query history, and any additional information that we can bring in, feed that into our dedicated Context agents to generate descriptions, readmes, but also extract critical metrics and semantic information so these can be fully governed and certified within the platform. The next step is really to start activating this. As we build this foundation, yes, humans and domain owners can come provide additional enrichment, verification on top.
31:03 Everything's fully governed, so we can put in workflows that enable humans to contribute content, but with approval and guardrails in place. But the real goal here is now to start activating this information outside of the platform so humans and agents can discover and trust this information. So one way we do that, very common pattern, is through MCP. So MCP can really enable context in any tool. In this case, I'm going to show you my personal AI client, which is Claude, and how I can use the Atlan MCP to find or understand information.
31:52 So let's say, for example, my peer said, "Hey, you're running a revenue analysis, use fact orders in Snowflake." I've never seen that. This is the first time I'm hearing it. I want to build off of it, but I'm not sure. I say, "Hey, Claude, can you summarize the Snowflake fact orders table for me?" And it will go pull from Atlan, find that exact asset. In this case, we actually have a lot of fact orders across a number of different sources, but it was able to identify the fact that you're likely talking about the gold layer fact that we just saw previously. It's verified, great signal. It has an owner. Here's a breakdown of the structure. Here's how it relates to other components in the business graph. And lineage shows me where it's coming from. So I have a complete picture of how this was sourced.
32:43 It is also, based on the information, going to call out some potential issues. So if I was the owner of this, I might want to dive into a readme mismatch, why we have multiple versions of net revenue. It's a demo environment, so we've created five different net revenues over the years and have not done a good job of cleaning them up, but hey, Claude and Atlan MCP are making that very clear to me now. If I see data quality issue failing, for example, I could go deep. I can say, "Hey, I want to see upstream lineage that we saw previously." Without even having to go into the Atlan UI, we can get a full visual experience here in our tool of choice.
33:27 So Atlan, that we saw previously, was all UI-driven, but more and more via MCP and the lakehouse that we make available, we can enable AI-driven workflows or almost like a headless experience of accessing and activating context in Atlan. So I can continue my conversation and say, "Hey, I don't want to read through this lineage. Summarize the breakdown, how this transformation's happening." If I wanted to understand all the ins and outs of the dbt model, I could pull that context from Atlan via the MCP and ask Claude to enable that, or at least a reason to process all that information.
34:11 Helps me move faster so I can get to actually answering the questions that I want and leveraging this context. So this is more of a discovery, understanding assets via MCP. The MCP can also enable agents that are doing talk to data to effectively pull trusted context before even running and answering a business question. So here in Snowflake, we created a dedicated finance agent that is available via Snowflake Intelligence to allow users to start asking natural language questions. So here I asked a very straightforward question about what is our delinquency rate.
34:58 This is pulling off of bank information. So the first thing it can do with Atlan MCP enabled and an extraction on this agent is to go find verified glossary terms that we saw previously that we likely extracted via our metrics agent. Identify the tables, again, verified that are associated with that metric, and so we can find the silver tables or the gold tables that are associated there. Bring all that contextual information in before actually even running the dedicated SQL so that we know the agent is not having to go search across the entire data estate here in Snowflake to hopefully find a relevant column.
35:42 It can start. It has a map of how to navigate the business, what metrics exist, and where to go find that information and provide a reliable and consistent answer. So, the next user that comes and asks a slightly different phrased question, but still looking for delinquency rate, is not going to get 12.5% and a completely different number. And so that's where as we start to build this universal context layer across your sources, enrich, and certify information, we're providing the trust signals and gold layer context for agents to leverage so that as you start to roll out and build production agents, they are building off the same trusted context.
Q&A and wrap-up
36:36Ryan Quigley
36:36 So with that, I'm going to stop for now and check the chat here. I'll jump back into our slides. if you liked what you saw today, please come join our context conference next week. It's going to be an amazing set of sessions, kind of talking about the why behind this, use cases from actual customers of how they've approached it, you know, pitfalls, lots of learnings. I think it's going to be really great. I'm excited and I'm going to attend. So, if you're available, I would encourage you to come join. You'll see and hear kind of way more about the Atlan platform and how it's actually helped, enable customers in their agentic outcomes.
37:23 Let me check the chat here. There's one question about, enriching semi-unstructured data like PDFs. Yeah, that is an area where, either the agent template that we saw previously ... Look, I got logged out. That's too bad. let me quickly try and bring this up since we have a minute to. So in our agent studio, we can extract from those sources of unstructured information. We also can bring in, let's say on this case, you can see here we have skills, which are not a traditional structured asset like a table. but we also can bring in knowledge files to enrich as well.
38:13 So this is currently limited to flat files, so not videos. I would say videos could be done potentially through like Blob storage. So we could crawl S3, GCS, ADLS, for example, and that information could then be governed, and enriched. We're often not going to be actually reaching into the content of that, like in processing the video to say, "This shows a picture of a mountain," for example. So I'll stick around for a few minutes here, in case any other questions pop up in chat. If not, thank you all for joining. Hope you learned something, got a little flavor for how Atlan approaches context, and yeah, hopefully I see some of you in the future.
39:29 Ooh, will this recording be on the official website? yeah, we do have a demo portal, and let me bring that up just to show everyone what that looks like. Oops. There we go. so a lot of this content exists already. view all demos, and so some of it is chunks. It's targeted at specific use cases, which is often better for consumption for some users that are looking for lineage. They don't want to come watch my 45-minute session. Everyone that attended will get a link to the recording as well if it doesn't make it onto the platform. But if this particular one doesn't make it, there are other sessions recorded. It's kind of the same flow.
40:21 But yes, I would encourage everyone to check this out, and I think I can drop this in the chat. All right, I think with no more questions in the chat, I think most people have dropped off. I'm going to adjourn for the day. Again, and so on. Thank you.
41:17 Hope this was helpful and useful, and yeah, have a great rest of your week.