
Activate Your Modern (Meta)Data Stack
Live demos
Want to watch a live demo?
Atlan engineers bootstrap, test and deploy enterprise context on real data.
See it on your own data
Walk through how a context layer would work on your stack, with our team.
Talk to usAbout this session
60 min5 speakers
Recorded at Atlan Activate in October 2022. Varun Banka sorts metadata into six kinds and lays out how a metadata stack captures and publishes it. Meera V covers the Fivetran Metadata API, Vikas Jain Snowflake tags and access history, and Cameron Afzal the dbt Semantic Layer. The demo ties them together: cross-source lineage, masked PII and dbt metrics in Atlan, Slack and Google Sheets.
Speakers
- MattAtlan · Host
 Varun BankaCo-FounderAtlan
- Meera VLead Product ManagerFivetran
- Vikas JainSenior Technology Alliances ManagerSnowflake
- Cameron AfzalProduct Manager, Semantic Layerdbt Labs
Full transcript11 chapters · searchable
Welcome and audience poll
0:00Matt
0:07 Hello, everyone. Thanks for attending Activate Your Modern Metadata Stack event today. We're super excited to have you all here. And to get things started, we wanna really just kinda interact with you as an audience and start to understand, you know, what are some of the challenges you face as an organization when it comes to data. So we'd love to hear some of your thoughts and, and answers around this. You can use the QR code in the left-hand side, or you can look in the chat for a link to basically put in your answer, and we'll examine that for probably the next minute and before we get started. So let's see what people are, are saying.
0:48 Awareness of the data, tribal knowledge is something we hear a lot of. Data quality definitely top of mind for a lot of people. Transparency around the data. Data governance, competency. Data governance, quality, and competency, top of top of minds right now. Data is accessible, definitely. Great. Thanks for taking time to participate in this. We really appreciate your answers, and, and it really helps set the stage for what we're gonna talk about today when it comes to metadata. So with that, I'm gonna turn it over to Varun, who's one of the co-founders of Atlan. Take it away, Varun.
Speaker Introductions
1:34Varun Banka
1:35 Thanks a lot, Matt. And again, welcome one and all to Atlan Activate. And thank you for amazing feedback from the last time we connected. So we decided to bring back the best of the metadata world to all of you. And thank you to, I think, hundred and eighty-nine plus and counting people across different time zones to join us for this event. So I'm Varun Banka, co-founder Atlan, and I also have some amazing friends and partners from the modern data stack today who'll be talking a bunch about the kind of metadata investment they are making in the modern data world. So I thought of how to get started and how to introduce these folks.
2:14 So I thought, "Let's go after the acronym, the famous acronym ELT, extract, load, and transform." So we will follow that acronym. So from the world of extract to load, we have Meera Viswanathan from lead product manager, Fivetran. Once you bring that data from Fivetran, the data gets loaded into your warehouse. So we have Vikas Jain, senior technology alliance manager at Snowflake. And you can't forget the T in the ELT, so we have folks from dbt Cameron Afzal, product manager, dbt Labs who looks really fresh after Coalesce, at least in the mugshot. So excited to have him speaking here as well.
Agenda
2:58Varun Banka
2:59 So on that note, let's get started with what the agenda looks like today. So we will get started with a quick thirty thousand overview of what the world of metadata looks like, just bringing everybody on the same page. There are diverse people, different personas who've joined us, so bring everybody on what metadata looks like. Then we will hear the panel, what their perspective is today on the world of metadata and the kind of work and investments that have gone in. We will pray to the demo lords and then do a live demo. And like Matt said, in case we have some time, we will take in some live Q&A as well.
3:36 So at this point, I want to give just a quick disclaimer. For the next forty to fifty minutes, you will hear the word metadata h-hundred times. So in case folks are interested in playing a drinking game, this is, this is the time. So on that note, let's get, let's get started.
Diversity in Data Teams
3:57Varun Banka
3:57 So at Atlan, we were a data team ourselves. And while we were building a data team, we realized diversity is a feature of data teams. It's not a bug, right? And when I when I use the word diversity, this is what we mean. One, there's diversity in humans of data. There are analysts, engineers, scientists, business users, and you name it, right? There are numerous titles that are floating around on LinkedIn, and I'm sure here there are multiple personas as well who've joined us on this call. There are diversity in data tools, like data teams use variety of data tools, like from data stores, warehouses, collaboration tools, integration tools. There's plethora of them.
4:40 There's diversity in data assets. Data teams just don't look at tables of views. They look at dashboards. They look at metrics. They look at pipelines. They read means. There are notebooks, and you name it. And last but not the least, because of the diversity in people, tools, and assets, there is diversity in use cases. When every data team, depending on the maturity, where they are, what the stack looks like, the use cases keep differing. Now, because of this diversity, this creates chaos. And in fact, this is a flow diagram. If you have to answer this famous question about, "Is the number on the dashboard okay?"
5:22 You'll have to go through— most teams go through a similar complex flow. And I don't think I even want to spend time on this webinar because we might take just three hours going into this flow diagram to understand how a data team today answers the question about, "Is the number on the dashboard okay?" And in fact, this diagram reminds me of the famous decision matrix Slack has. So Slack today once— if they have to decide to send a notification, they have this amazing decision matrix that they follow before they decide to send a notification. And I think the same kind of decision matrix applies to a lot of questions that data team try to answer.
6:00 Now, once we saw this chaos, we started— we did a thought exercise. Some of you might know this number. There's a magic number of one fifty. So researchers— Some researchers say that there is a cognitive limit on any human group. So... And this is called a Dunbar number. And in fact, if you extend this to, in fact, some social media platforms earlier on, some researchers started digging, and they said that you can you can only manage one fifty friends on social media platforms like Facebook and Instagram. And that's what Dun-Dunbar number meant because of the constraint that primates have. Amazing research.
6:39 I've shared the link, feel free to check out in case some folks are curious, right? So we started asking ourselves this question, right? About what does this mean for data assets and data tools. There is equal diversity, there's equal number of assets. So the opportunity for us was, can we figure out what does collaboration mean?
Principles of Data Teams
7:00Varun Banka
7:00 So on that note, what we started doing is we write— we started writing some principles for our own data team to figure out, well, how can we create a winning data team. So it, it comes across three pillars: knowledge, collaboration, and trust. And today, we'll talk a bit about all three of them. First, knowledge. So knowledge is about how do we create an environment to facilitate easy reusability of knowledge, documentation, information, insights for data teams. This is the foundation pillar for data teams. Without knowledge, there is no collaboration, there is no trust. The second pillar we scribbled was collaboration.
7:49 This is self-explanatory, right? But I think— but the important word here is how do we create embedded collaboration? How do we create collaboration where users are? If somebody is on a BI dashboard, how do we enable collaboration right from there? Or similarly, if somebody is on their notebook, how do we create collaboration right at the point of where the users are? And last but not the least, trust is the center of all of it. You might have create great knowledge, reusability documentation. You might create great collaboration. But without trust, there's no effectiveness of the collaboration and democratization of this knowledge. Now, once we started building these pillars, we started thinking about, okay, what's the glue?
8:36 Like, how do we bring it all together? It makes sense. Makes sense that we have these strong pillars, teams teams are facilitated with these pillars. Now, what's, what's the glue that binds all of this together? And we found our answer in metadata. You can say data about the data. Now, for some folks who might be new to the metadata world in case you don't relate to the word metadata, you might want to use the word context, which I'm sure is a word that gets used a lot in the hybrid world that we are in, which is, do you have the right context?
Types of Metadata
9:12Varun Banka
9:13 Okay, so let's, let's go next. What are the some kinds of metadata that exist? So obviously there are different kind of groupings. People group them in different ways. This is how we set this up from an Atlan perspective. One, you have technical metadata. This could be what schema your tables are, what's the row count, what's the data type of your columns. Governance metadata. Who owns the data asset? Who owns the data product? How is the data classified? What are some business terminologies, acronyms that are linked to this? Operational metadata. This could be the code, the actual SQL snippet that's actually moving the data from one, one layer to your other layer.
9:51 The dependencies that exist, what is the runtime details? What's the time it took to actually run? Collaboration metadata. These So we believe there's ton of conversation, I'm sure in all of your teams as well. There's ton of context that gets shared on Slack, your Microsoft Teams. So how do we bring those conversations, which is again, rich metadata that's relevant for data teams as they think about collaboration. Issues. There might be issues that might be lying around in Jira tickets or any of your ticketing tool. How do you bring that together? There's rich metadata there. Quality metadata.
10:25 This could be the basic minimum metadata, like minimum, maximum, what's the freshness, what are some— If you're running some test, there's ton of metadata, again, from a quality perspective. And last but not the least is usage, which is how many people are using this dashboard? What's the last time this was used? What's the popularity? When are these tables getting used? So technical, governance, operational, collaboration, quality and usage.
The Metadata Stack
10:53Varun Banka
10:53 Now, if you have to bring this together from a stack perspective, what does this look like? So let's, let's start from left of your screen. If you're facing the screen, let's start from the left side of the screen. On the left side, you have all the tools and the source of truth for a ton of metadata that exists in the modern data stack and all the toolings that we use. You have the data stores like the warehouse, lakes of the world, your databases, your Kafka streams. Business intelligence. This could be your BI layer, your Looker, your Tableaus of the world. Orchestration and pipelines, and today we'll talk about one of them.
11:28 We have Fivetran with us to talk about some of them. Source version control. Lot of projects like Looker and DBT core implementation are all source version control. Data quality tools. This could be internal frameworks that you've built on open source frameworks that the teams might be leveraging. Collaboration tools. Communication tools like Slack, Teams and knowledge management which is my docs PowerPoints, Confluence docs, and the Notion— the new age Notion docs of the world. So th-that's the source of the truth, right? Now, but how do we bring this together to drive the use cases that we are looking at?
12:07 So the first step is how do we make it brain dead easy to capture a ton of this from these sources? So in fact, in the last 12 months, there's an interesting change that is happening in the ecosystem. Lot of data sources, data stores are creating their own metadata APIs, right? We will hear today about... Similarly about Fivetran and DBT. Similarly Power BI have set up the scanner API in the last 12 months. And similarly, there is a amazing movement on a lot of these metadata APIs that are getting created in these sources. System views.
12:40 A lot Snowflake, and we'll hear from Vikas today about how Snowflake has invested on a lot of creating a lot of system views, audit history, trail logs, dependencies, and how they're exposing this natively on Snowflake to enable some of these use cases. And obviously, like, like the data world, the metadata world also has variability. You have metadata in JSON, CSE files, in Slack threads, in documentation, web URLs, in all of these files and formats. Once you bring that in, you have to clean it, process it, deduplicate it and then decide to publish it so that people can search, filter, aggregate, and drive reporting. But it's not just about bringing metadata in, right?
13:23 Because if you just bring this in, this will be another silo that get... Will get created for metadata. So how do we create metadata interfaces so that metadata becomes portable, so that more and more folks can use it? So, one, obviously, data consumers love UI. They love interacting on the UI. Data engineers love leveraging REST APIs and build programmatic use cases on metadata. How do we do real-time change events? If a classification... If a new asset has a classification that got added in DBT, how do we push that into Snowflake so that access control is maintained in Snowflake? So flows like that.
13:59 And last, this is a new paradigm we are opening up, of how do we also expose the raw metadata also to users to drive large scale metadata reporting large scale, and in fact, even look at build their own classification models if for metadata. Now, on the last part of the screen, what you see is all the metadata activating use cases. This could be data discovery, lineage, knowledge management, governance. There was a big bubble on quality, metric exploration, and we'll talk about some of them in the demo today. So we'll definitely get back to this slide during once we do the demo. Today we'll cover some of this as part of a live demo.
14:41 But before that, before we jump to that, let's hear from some of our partners. So I'm gonna first pass on to Meera, Fivetran to take it over.
Meera V
14:53 Oh. Well, thanks, Varun. Perfect.
Fivetran’s Perspective on the Metadata Stack
14:58Meera V
14:59 This aligns perfectly with how I'm starting off my slides about Fivetran and how we are excited to partner with with Atlan on sharing this metadata and really helping with that capture process so our customers can make better decisions about their data itself. So the first step is we really call it governed data movement, 'cause the focus is Fivetran is not a governance tool, but we wanna make sure you have the appropriate level of governance using tools like Atlan while you're moving your information across from source to destination. What is the problem? Data access, right?
15:33 And data access cannot happen without a very clear governance strategy, and this is really where we've seen a lot of our customers fall over. As they start scaling and as they start getting to a stage where they have several sources, several destinations, distributed data teams, you start off with a core data team who just have this ever-growing, growing queue of data integration projects, people coming up to them and saying, "I need to set up a new source. I need access to a new column," or, "I don't even know that this data is coming from this specific source," because typically in the past, governance has always started at the warehouse.
16:09 So with that, access becomes very difficult because, on the one hand, core teams have security and legal telling them that they need to make sure that their data use is in compliance with any of the organizational policies. And on the other hand, they have these distributed analyst teams who want access to to data itself. And when distributed analyst teams have to wait for too long, what they end up doing is relying on rogue data teams, and rogue data teams means you don't know if you're actually accessing the right data or making business critical decisions with the right information.
16:46 So this is really where the, the focus of governance really comes into play, and I'm gonna focus on really the for extract and capture layer one and two of this pyramid. So the first step is pipeline. For extract... For the purposes of extract, it is extract and load. It means primarily pulling data from the source and landing it in the destination and automating it as much automating as much of it as is possible so data teams are not overwhelmed. So that's really where we have focused most of our efforts over the past ten years.
17:22 Building on top of that, the next step is as we start incorporating security and legal and data engineering and data analysts starting to use this tool, one of the biggest things they need is visibility. For security and legal, that means being able to audit how people are using the data. For data engineers, it means understanding what changes happened upstream and who impacted those changes so they can respond quickly. And for analysts, it's as simple as what data is moving through Fivetran and where did this data come from?
17:53 So working with partners like Atlan, Snowflake, and DBT, we think we can provide this level of visibility and transparency so you can make decisions and really provide metadata at different components or different layers so you have the context. And from a pipeline perspective, that really comes down to data in flight. So being able Get full visibility into your data as it moves from source to destination, and this gives the unique context of being able to say, "What is the location that my data came from? What specific system did it come from? Is it a, is it a QA system? Is it a production system? Who owns that system upstream?"
18:33 So your context and data really starts all the way from the source onward, and we think that the first place where you can start implementing governance is in the pipeline because obviously data is at rest in the source. So that's really where we want to, again, start sharing this information and be a better partner in the ecosystem itself. So with that we are super excited to share that we have a beta product, the Metadata API, that we've been working with Atlan on. And what the Metadata API does is the core use cases is exactly what we have described before, which is, first off, what data is moving through Fivetran? Where did this data come from?
19:13 Where is it landing? What changes have happened upstream, and what users have impacted these changes? So me, as a person, I don't end up sending PII accidentally, and if I do, the core data team or the security team can immediately action on it. So with that in mind the Metadata API is something that we are working with Atlan on. And the purpose of that is to start off with column-level lineage.
19:39 How can we show information within the Atlan UI where you can really trace the data back to the, the column, the specific source column and then also identify the owners of the pipeline so in case you have any questions, in case you want to identify if it's the right data you're using, you can you have access to the owners of the pipeline. So you really are not making decisions in a silo, but you have information about the people who may be the subject matter experts there.
20:12 We are super excited about this 'cause what really helps over here is that we want to show a future state of data access where we remove the need for rogue data teams and remove the need for people landing or relying on low-trust data. So with that, they... We want to drive ownership to the data producers, have the core data teams manage the infrastructure, support the higher-level infrastructure as the data team scales, have data analysts get access to fully trusted data, again, in the context of data in flight, and security and legal teams have full visibility into everything that happens within the pipeline.
20:48 So really, data access is not limited by old school or outdated governance policies, but we're keeping in, in line with the modern data stack and all of the amazing work that our partners have done as well. And with that, I'll pass it back to you, Varun.
Varun Banka
21:07 Thanks a lot, Meera. Thanks for this. We are super excited as well to bring a lot of these metadata API use cases on Atlan. Passing on to Vikas to take it forward.
Snowflake’s Perspective on the Metadata Stack
21:17Vikas Jain
21:17 Let's look at what Snowflake Data Cloud is first. It's a global network that connects you to the most relevant content powered by a single platform. The platform has three architectural layers: optimized storage, elastic performance engine, and intelligent infrastructure that includes metadata, security, and governance, the topic for today's talk. Snowflake has three types of metadata: object types, object definitions, and object properties. Almost everything in Snowflake is represented as an object, such as an account, database, and tables. Object definitions include things like view definitions, stored procedure definitions, policy content, and so forth.
22:03 Whereas object properties contain things like table column names comments, tag values, and so forth. So this gives a idea of what metadata looks like in Snowflake. And on the data governance side there are three pillars that we use for governing the data. Know your data, protect your data, and collaborate with data. To know your data, you need to discover what's out there, classify the sensitive information, determine lineage of where the data came from, and create master data for certain entities such as customers. To protect your data, you need access controls at multiple layers.
22:52 Network layer, user, object level, and column level, and so forth. Once you have governed data, you can then securely collaborate and share data internally and externally. Snowflake provides building blocks for partner solutions to integrate natively with the platform. These building blocks provide an optimized and secure experience for our customers. For example, metadata can be discovered using account usage views that Varun talked about and information schema. Sensitive data can be classified and tagged. Lineage for data can be determined using access history and object dependency views.
23:34 Similarly, to protect the data, there's network policy, user authentication, role-based access control, column-level masking policies, and row-level access policies available. And finally, data collaboration is enabled through secure data sharing and data marketplace. This native integration architecture ensures that security and governance can't be bypassed while allowing the users to use any type of tool to access data in Snowflake. Next, let's look at a few of these building blocks in more detail. Snowflake supports native tags that can be applied to any object, account, database, or a table.
24:24 Using access history, you get detailed information about who has accessed what, including any indirect access to tables through other objects such as views. The access history rights allow you to get detailed lineage on data movement within Snowflake. And with object dependencies, you can understand relationships between various objects, such as between an external stage and a external table or a materialized view that was created from a table. With column-level security, you can dynamically mask sensitive data at query time.
25:14 And with row-level security, you can filter out unauthorized rows at query time. And you can create data clean rooms using building blocks of row access policies, stored procedures, secure data sharing, streams, and tasks. And in summary, partners like Atlan have used these building blocks to provide more cohesive experience to solve all your use cases regarding metadata and data governance.
Varun Banka
25:54 Awesome. Thanks. Thanks a lot, Vikas. Thanks for giving like a one-on-one Snowflake. We're super excited. We're especially excited by the new Snowflake tags that are coming up. And I think we have a lot of customers who want to now start leveraging that to drive access control, manage security at a Snowflake level. So super excited about that. Thank you for sharing.
Vikas Jain
26:14 Yes, and we are super excited with, with the partnership and the work that we're doing with Snowflake.
Varun Banka
26:20 Awesome. So from the world of warehouse, let's move to the world of transformation and semantics. So passing on to Cameron to take it over.
dbt’s Perspective on the Metadata Stack
26:30Cameron Afzal
26:30 Hey, everyone, great to meet you all today. We are also very excited about our partnership with Atlan and excited to show what we've had in the works in the world of metadata. But first, a little bit about dbt. Dbt enables analytics engineers and data engineers to essentially work like software engineers. If you have SQL skills and we even just extended to Python support, you'll be able to overcome problems of data quality and trust. So a few of those problems are development silos that lead to analytic debt. If you've ever worked with a bunch of custom queries, you know what I'm talking about. The second challenge is opaque logic and difficult-to-investigate logic.
27:08 So really not understanding the lineage, where data come, comes from. And I think ultimately the most important thing here is trust. Trust in your data, trust in the logic that's being used, and the insights you're driving from analyses. And metadata plays a key role here. So dbt standardizes the development with a workflow that enables these analytics engineers to test, deploy, and document analytic code. So pulling from any number of sources, doing that transformation throughout the process, and even defining metrics on top of your models, and ultimately getting that data into your dashboards and other tools of consumption, as well as your catalogs like Atlan. So that's a bit of a primer on dbt.
27:50 There's lots of great documentation available online if you're curious. But today we're here to talk about metadata, and one way we work with metadata at dbt is the dbt Cloud Metadata API. So the Metadata API uses metadata generated by your dbt runs, and it can produce information about seeds, sources, models, tests, exposures, and new to the field, metrics. So this allows you to get information about all of your different dbt assets, whether that's lineage, freshness, descriptions, dimensions. All of this valuable information captured in a dbt project is now accessible in downstream tools like Atlan. There's even a sort of feedback loop here, like we'll talk about in a second.
28:36 In a tool like Atlan, you can define, let's say, a verified metric or a verified model in your dbt project, represent that in Atlan, and iterate from there. Here's how Atlan leverages dbt metadata. You can import your metrics, and so that's both your list of metrics and information about the metrics. You can import your models which provide information about your models, but otherwise known as a dataset. So what is going on with these datasets? What do they represent and other information that you've encoded. You can import sources as well. So these are the data sources that feed into datasets such as a, a Salesforce, per se.
29:15 And the really cool thing about Atlan and how it works with dbt is it provides column-level lineage. So when you're looking at lineage, we'll look at an example in a second, you can see how the dimensions fit in there. And finally, Atlan has a capability called Process, which is tracking how Atlan interfaces with your dbt project. So here are some examples here, and you can see that green check mark is a verified, you know, whether it's a model, a source, or a metric. And so you can understand, like, is this a metric or model I want to use? So this is Atlan's capability working hand-in-hand with the flexibility of dbt metadata.
29:54 All right, so one prime use case of the Metadata API is the dbt semantic layer. So the Metadata API is part of the semantic layer. It's a big part of our partnership with Atlan, and that we're excited to share with you all today. And I know Varun's gonna have more to share beyond these slides as well. All right, so the reason we built the semantic layer is to improve the efficiency and trust of your analyses. So let's say you're trying to answer a question like, "What was revenue in June?" You might have people arrive at different answers based on the tools they're using, how they're calculating revenue, what data they're using.
30:30 This is a really challenging problem because ultimately we're making decisions based on our data and the metrics. That's like the point of data analysis. And if people can't trust the output, then, you know, it's a very challenging problem for the business. So the goal of the semantic layer is to solve these challenges around consistency and precision of your metrics as well as your models, but we'll focus on metrics today. So as you can see in this diagram, you know, an organization might have a number of different tools with a number of different users, and they're pulling based on data in the warehouse.
31:03 But the value out of the semantic layer is providing a common layer for all these different tools. So our goal, our goal is to enable you to save time defining metrics and other dbt assets once, accessing them via the semantic layer natively and your different tools in your data stack, leading to more consistency and trust. And we're very excited to work with Atlan on their integration. All right, so how does metadata fit into the semantic layer? So part of the semantic layer is certainly querying the data, as we just saw in that diagram. Part of it is also accessing the metadata.
31:36 So dbt metadata enables discovery and provides context for semantic layer users, including in Atlan. So that's folks being able to access that list of metrics and models, view details about them. Generally, integration partners approach this in a four-step approach. The first is importing and syncing model and source metadata. We already saw that Atlan does that. So then you can understand dimensions, tests, and freshness. The second is importing and syncing metric definitions. So metrics are fairly new to dbt projects. We're seeing a lot of adoption, but they, they are something new and definitely a key component in a semantic layer.
32:12 So metric metadata gets you metric calculation, dimensions, description, and even that verified tag that we saw in that earlier screenshot. Third, most integrations connect to the dbt proxy server as a data source, and then finally query the imported metrics via UI. Atlan's built all of these, and we're very excited to continue collaborating on the evolution of this integration. But as you can see, metadata plays a really key role in the semantic layer. You have to understand these dbt assets in order to know what to query and how to interpret the results. Awesome. So here's a primer on Atlan's current semantic layer integration.
32:47 So I view it as really a story around discovery via a data catalog. And, and even speaking personally, as a user of our internal assets, I wanna understand what do we have, what's already defined, how should I use it, should I trust it? And so being able to view these different metrics, understand their definitions and preview values, understand lineage, including column level lineage, and viewing related assets is a really important part of this discovery process. That's certainly not all that Atlan and the semantic layer provide, but I think that's a salient user story here. So just a few screenshots here of how the semantic layer is incorporated with Atlan.
33:24 And you should be able to use this coming up soon. You can see a list of metrics here, as well as your model sources, columns, and processes as we discussed. And we can note which metrics are verified, which are in draft mode and which you probably shouldn't use yet. I can view details about the metric, including previewing the values. So this is going beyond metadata, also querying the semantic layer, getting the actual data at that grain. Here's a breakdown of the lineage graph, including column level lineage. So this is pulling from the metadata API. And finally being able to view the related assets for this metric. So I'll turn it over to Varun.
34:01 I know we have more demos to see, but we're very excited at dbt Labs to continue working with Atlan on the semantic layer integration and usage of the metadata API more broadly. Thank you all.
Varun Banka
34:13 Thanks, Cameron. And, and thanks, everyone. Thanks, everyone to just set up a primer for what does the new modern metadata stack looks like in the modern data world. So the interesting way before we jump to demo, and thank you for two forty-two people who've stayed on. We've definitely crossed the Dunbar number today. So excited to go into the next part which is the demo part.
Live Demo
34:37Varun Banka
34:38 So let me just get started. I'll share my screen and pray to, like they say, to the demo lords, and we will go from there. So before we get started, this is how... So this is the slide I left everybody with before we, before we ended this conversation, right? Which is what does the metadata stack looks like. Which is how do we look at capture, how do we look at process, publish. Because there's ton to cover, so we broke down this demo into three, three things today. We'll cover some part of the capture world.
35:08 We will look at how with Fivetran, dbt, Snowflake, how do we bring the technical metadata, business metadata, some of it on Atlan. And then we will talk about two metadata activation use cases. We will look at data lineage, and today we look at metric exploration. So this is how we'll break down. Let's get started with the capture part of the process and how do we make it brain dead easy to bring a lot of the metadata that I talked about today. So first to begin with, you should be able to see the Atlan workspace.
35:41 And we will just go to the our metadata marketplace, which has direct connectors and packages for you to bring the metadata from your favorite tools. So let's start from Snowflake. Obviously, we've curated the instances. So just like you can set this up, it's completely DIY. Bring your credentials in, put test some of those credentials. If you want to know what metadata do we bring in from Snowflake, there are docs, rich docs available. You can look at them, and we can bring in all the technical. Vikas, all the metadata that Vikas talked about, we'll be able to bring that into Atlan.
36:18 Similarly, if you are a Fivetran user and you're using that to bring the metadata and you've enabled the Fivetran API, all you need to do is two-step process. Just get the API key from your console and the API secret, and we'll be able to bring operational metadata Create cross-source lineage and bring all the technical and operational meta data into Atlan. And similarly, if we also have s-native support for DBT, and we support both the implementation, so in case you're a DBT core customer as well you've implemented DBT core or you've implemented DBT cloud, you can bring all those in.
36:58 We are semantic layer ready as well, which, which is what Cameron talked about, which means if you have started adopting DBT metrics, you'll be able to see first-class experience on Atlan with DBT metrics. Now, so we brought in all the technical metadata into the system. Now, a lot of our customers reach out saying, "But how do I keep this metadata refreshed, updated?" Right? And so one, one trend we're seeing in the metadata world is it's similar to what happened in the world of security, where security moved towards left.
37:32 What that meant is while engineers were coding, security moved closer to GitHub, the source version control, vulnerability management, all of those moved closer to where engineers were writing code. Similarly, this happened in the world of DevOps and cloud as well, where you move everything closer to where the infrastructure was getting created. Similarly, we are sharing a lot of be-best practices with customers to actually push a lot of this metadata closer to the source. So if you're a DBT customer, we leverage— You can actually update the certification, the owners, all of this in your DBT model. You don't need to leverage the API while you're creating the model as an analytics engineer.
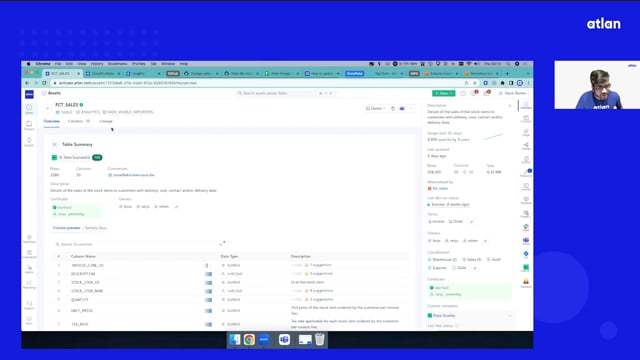
38:10 You can actually bring all the governance metadata into Atlan. So that's one paradigm. Similarly, if you're using Snowflake tags, again, we can bring some of those Snowflake tags as we build deeper integration with Snowflake going forward. Now, once you bring that in, once everything is set up, this is, this is what you feel like. You get a whole discovery. I think somebody mentioned on chat inventory. So you get a list of all the assets across all your sources available right on Atlan. You can get to see the technical metadata that we brought in from Snowflake. We brought in the materialization metadata, what models was this materialized from. You can see the raw SQL.
38:51 When this was DBT cloud last run, you can get to see the operational metadata. You can get to see owners, classification, certification, and you can bring everything in. Now, in our learnings with data teams, we still realize there's a lot of tribal knowledge that exists in minds of people. And but how do we bring that on Atlan? So we took one step forward, and we went to everybody's favorite tool, which is spreadsheet. So let me jump on this moment. Let me jump to a spreadsheet, which is a Google sheet. So Atlan has a native extension with Google Sheets where you can capture tribal knowledge, collaborate.
39:33 Let folks who are working on maybe want to bring descriptions of they have a data dictionary or they have an existing CSV where they have documented everything, bring them quickly. So I'm g-just gonna click the extension, Atlan extension, and give it a command to document metadata, and let's select an asset first. As soon as I selected that, you saw the Atlan interface is just opening up where you will see Similarly, you will see all the assets that you saw on the Atlan workspace, you will start seeing it on Google Sheets workspace. Now, let's select this big verified asset. Let's import that. As you see, the, the imports are happening.
40:15 We are bringing existing metadata from Atlan to your Google Sheets. Now, all the metadata is right here. Now you're like, "Hey, I think I know this six-digit reference." And I'm gonna just, for the sake of demo, I'm just gonna mark this as a verified column. And obviously, I can share this with my colleagues, people who know and collaborate this in the tools that they really like. Once I'm ready, all I need to do is let's sync this to Atlan. And this is again our effort. We've realized, like I said, diversity in data tools. Data teams love using the tools of their choice. How do we make it easy, bring to them?
41:00 So looks like the documentation is synced. Let me just open up the asset. It opens up an asset three-sixty profile. This is similar to what a Salesforce account profile looks like, what a GitHub profile looks like. You, you can see the description got updated. I, I am also seeing some suggestions from Atlan saying that, "Hey, this is a description that Atlan suggests." Let me just accept a few. So this looks like tax paid in dollars. Accepted. The enrichment done. Right. Now maybe let's, let's open up let's open up an asset. Now, beyond... So we brought in technical metadata. We brought in the tribal knowledge that exists in orgs via collaborative spreadsheet.
41:49 Now, the other metadata that you see is your profiling metadata. So this could let's maybe look at a column. This could be tax paid. What are the distinct values? What's the minimum? What's the maximum? What's the variance? So you have— If you have existing profiling metrics, you can start pushing it to them. And at Atlan also, we are also soon opening up native profiling where you can actually, in our metadata marketplace, you can open up, bring profiling metadata on Atlan as well. Now, technical metadata, check. Operational metadata, check. Tribal knowledge, check. Profiling, quality metadata, check. But still, there is ton of knowledge that exists in orgs.
42:30 One of the things, if you remember the chart that we talked about was documents. Documents and URLs that exist. So let me open up one One document, and this is just a demo document. Maybe this is a glossary or an internal Confluence link you have internally. You are on that page, and you quickly want to document this because if you go to Confluence, you don't know what data asset this is the documentation for. And if you go to Atlan, you don't know what documentation it's linked to. So how we bridge the gap is via a browser native integration. So, so not only we bring Atlan to Google Sheets, we bring it to your favorite browser.
43:10 So as soon as I open Atlan this Atlan icon, I can start seeing the same asset list right here on my browser. If you can see, there's already a title. I can just click fact orders, and let's do a quick save. Again, just with a click of a button, the Confluence doc, the Salesforce doc, or any of your Word docs are available in the resource sections. So now if you go to resource, you will get to see, hey, this was just added by Varun Banka a few, few seconds ago. So this is about how do you bring documentation, your URLs to create that knowledge, create that asset three sixty profile.
43:49 Now, if you folks remember, we also talked about metadata on Slack, and I'm sure a lot of you will relate to this. There's ton of conversation that happens on things like Slack, and you want to capture some important threads. So I'm gonna just switch to a demo Slack workspace. You'll be able to see a demo Slack workspace with bunch of channels and a Data Gurus channel, which seems like a lot of quest-questions get asked here. So I'm just gonna click this three button, and you will see a command saying s-send to Atlan. As soon as you click this, it will open up. You can give a title saying that location thread for discussion.
44:36 I can select the asset which I want to tag this to because this is an important thread for this. I can quickly search in Slack and say submit. Now as soon as this happens, you will see the Atlan bot quickly give you a notification that resource was added, and it unfolds a rich metadata right here. So everybody asking the question knows that it's— the knowledge is getting reused. The questions— once, once the question gets answered, it can be leveraged by other people also in the org. So if I just jump to this link again, and now you will see the Slack icon on your right sidebar.
45:18 If I click this, you have all the threads that are available which, which you wanted to capture right here similarly on your Slack— on your Atlan profile. So technical metadata, tribal knowledge, operational metadata. We brought in messages. We brought in URLs. But even after that, there is something pending, which is a lot of data teams have context about their data. They know what patterns the data exist, and they want to do things and, and automate few things, right? So if you go to Atlan's governance section, we have a concept of playbooks.
45:57 Now we've set up some sample playbooks for the sake of demo, and it's a very rudimentary playbook that we've set up to make it easy for everybody to understand. You can set up your rule. So let's say, hey, I have an asset type column, and if the title contains maybe let's say username, it quickly gives me saying that, hey, there are five assets which contain username. This seems right to me. I'll do a quick review. And I'll say, okay, for these classifications, let's just attach finance and PII to them because I know for all usernames, irrespective of where those exist, I can look at that. Or maybe there is a certain schema.
46:38 You have like maybe a customer schema, mart schema, and you want to attach some metadata across these assets, and you want to automate that, so that whenever even a new table comes up, those are by default attached on those assets. So automation on day one, you don't— Once your playbook is set up, you can sleep in peace that your assets, based on your rules, are getting tagged with the right metadata and right rules and logic are in place. So, like, we are really excited about this, to roll this out for a bunch of our customers, and obviously, you can run this, schedule this.
47:09 If you want to run this on a regular basis, you can do all of those on Atlan. Okay, so quick time check. We have ten minutes, so I'm gonna go back, and we'll do a quick recap, and we'll get back to the second phase of the demo. So we looked at DIY set of via metadata marketplace, how metadata is moving left. People can bring in programmatic metadata via DBT YAMLS. We looked at capturing tribal knowledge via collaborative-first spreadsheets like Google Sheets. We looked at capturing profiling metadata. We looked at capturing documents, URLs from your browsers.
47:46 We looked at how do you capture tons of conversations that are happening to make them reusable, re-shareable, and we looked at automation via playbooks. Now, let's go to the second part of this demo. I can see a bunch of conversations happening on Slack. We'll come back to the end in case time permits. Hopefully, folks on the chat are able to answer some of them. We'll move to the next section, which is one of the activation— metadata activation use case, data lineage. Now, for this, instead of me moving to the Atlan workspace, let's go to, let's go to a BI. So this is a sample Tableau instance.
48:27 We're seeing a dashboard, and the famous question that a lot of people build data folks build up via intuition, the number on this dashboard is wrong, right? And how do you answer that? Today, it takes— We saw the flow diagram. Today, it takes a lot of flows, a lot of back and forth between teams, Slack conversations to get this right. But how do you get context right there where you are? Now, if you know the principle that I've been continuously talking about is we want to bring Atlan where data teams are, right?
48:58 So even with Tableau, you will see on the bottom right, I don't know how many of you can see this on Zoom, a Atlan icon. So what this means is as soon as I open this Atlan icon, all the metadata that we brought in in the first part of the demo is now available in Tableau in context for you, for the data consumer or the business users who's leveraging the Tableau dashboard. So you have the description, you have quick read me. They don't need to ask what this dashboard means. A rich read me. You can put in spreadsheets. You can know which owners are there.
49:30 You, you, you want to reach out to them on Slack, you don't need to find them. You can reach out to them on Slack. If there are groups, you can add your data team channels. You can look at whether these are verified or not. There are ton of scaled dashboards all data teams have, so you know whether you are on the right dashboard or not, and you know when was this last updated because if this is updated, you know that it's fresh, it's something you can leverage, right? But to answer this question, you need to know, okay, where does this data come from? So we go switch to quickly the lineage right here.
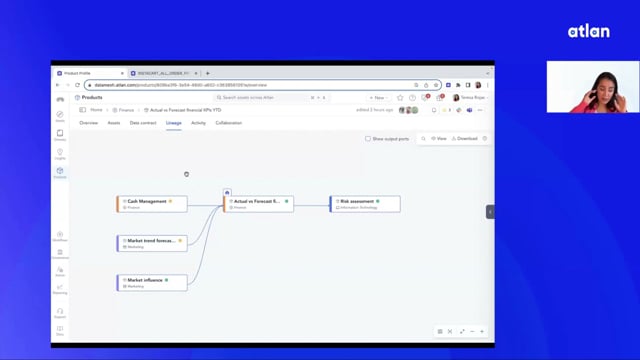
49:59 You see, okay, this comes from bunch of data source, data sources, Tableau data sources. But, hey, we want to know more, so let's jump to a graph view. So now we are switching back to Atlan. We've done a handover. We have got context. We came back from Tableau, now we're back to Atlan's interface. Now, how we set up lineage is in the form of exploration. A good principle to keep in mind, if you, if you see how engineers debug the code, they, they debug the code via breakpoints. They put different parts of the breakpoints, and they go step by step into different breakpoints understand. The lineage consumption experience for us is also very similar.
50:38 We want to give a great debugging exploration experience on lineage. So let's get started. Let's start the exploration approach. So we see a dashboard. We see, hey, there's a data source that's coming in, so let me just expand this. Looks like this is coming from out of the data source. So Now it suddenly starts connecting upstream. So we see there are three, three tables that it connects to. So there's fact orders table. There are some other tables which are coming from other schemas and databases, and all of them are feeding into this data source, right? But like, hey, this is verified. I, I can see there's an announcement as well.
51:15 So if I click this, I can quickly see, hey, data is synced, and this is the, this is the frequency it gets synced on. But let's, let's go beyond. As soon as we do that, you start seeing the DBT icon here, which means that this, these assets are actually getting materialized by DBT. So in fact, if I click any of them right now, you can see the model you can see the actual query, and in fact, if you want to quickly debug and look at go back to the DBT cloud console, you can... It has a URL, it switches you back, and you can come back to the context where you need.
51:48 We have the last run status, so you know whether this was materialized or not, or this is stale. All the information available right here in your debugging, in your impact analysis, root cause analysis experience. But let's expand this maybe. So let's... Because I see a warning here, so let's expand this. I think this further comes from some other layer in DBT, and now this comes over from a Postgres table. And if, if I click some of them, you will start seeing this is where now Fivetran pops up. So Meera was talking about how with the Fivetran metadata API, now we can do cross-source lineage.
52:25 We can see how your data has moved from a Postgres and how you've done ELT to your Snowflake warehouse. We can do Salesforce. If you're moving data from Salesforce to Snowflake, which is a common pattern that we see with a lot of teams, you can create that end-to-end units for that. But let's see. So let's see. I want to quickly see how my name is getting progressing, not only at a table level, now you can see at the column level how your data is going across.
52:51 So if I click name from your analytics, from your application layer database to your staging layer, to your mart, to the final table, which is powering the, powering the BI dashboard, you have end-to-end column-level lineage that is available right here. Now, let's take... Now, when I'm looking at this name, there is an interesting tag that I see here, which is the PII tag, which is Vikas was talking about bunch of tags, access control things like that. So maybe let's, let's look at fact orders table. So if I look at this, the fact orders table, and let me look at a quick preview. Maybe I'm a data scientist, and I want to get a quick sample.
53:38 I want to look at a quick sample, but as a data admin, somebody as a producer, I don't want to open up PIIs for the data scientist. I just want them to evaluate this, whether it makes sense from the models. And if I go to the location name, you will see the name as masked. So as a data scientist or as a producer, you can be comfortable you know that your PIIs are not getting leaked, right?
54:00 And because at Atlan we know the relationships across your data stack, your modern data stack, if you are able to, which you are saying, if you're able to add PII as add name at your analytics lab, maybe the engineer who knows because they are the one who created the schema, if they add it as the name at the Postgres layer, at Atlan, we can help you propagate across, across your modern data stack so that you know that if your PIIs are set up, we will ensure those paths through across the data stack. So let's go back again.
54:32 Let's do a quick recap, and then hopefully we have one or two minutes we'll be able to cover the last phase as well. So we looked at contextual embedded metadata, end-to-end lineage. We brought in operational metadata. You saw the approach around classification propagation, and once the tags are in, you can leverage data preview masking and ensure your data is secure. Which is why we're super excited about the Snowflake tags, so that we can actually push some of these classifications back to Snowflake as well, from an access control perspective. Okay, last one which is metric exploration. I think Cameron already gave a good heads-up on what the experience looks like.
55:15 So it's, it, it makes my life really easy, but we'll, we'll keep this quick. Step one, let's do Command+K, and let's ask the favorite question, which is: what does the revenue look like? And all you have is the revenue asset. So like I said, metrics is an Atlan native asset. As soon as you open up that, similarly, just like how you saw a asset profile for tables, you will get a metric profile for the metric. So not only you get the documentation, you get a quick preview, year-wise preview, you get to know the grains. You know that it's verified, so you can trust it. You can look at the dimensions, what orders they are.
55:54 And Cameron also talk about lineage. So if I go to Lineage, let me go to the metric Lineage. So you can see two kinds of views. You can look at an analytical engineer view, which is where does this metric come from, from a model perspective, so that you want to debug the model, change few things around. Or if you want to look at the physical layer, where which table does this come from. Again, all those, all the kinds of lineage end-to-end upstream is available right here, even at a metric level. Now, but what if I looked at this preview, and I want to do it month-wise or maybe year-wise?
56:32 So let's go to maybe a quickly Insights tab, which is our data exploration experience. So as soon as if you see the whole query experience is right here, select asterisks from. So let me open up the context so that we can make... We can build the right query. So this synthesis month, let me just quickly change to year to get a year, year-wise cut for this metric. As soon as I have this, again, this query is your underlying Snowflake layer and brings the values right here.
57:00 Now, if you want to quickly share it, maybe you're doing a board presentation or setting up a PowerPoint deck for any of your metrics, product metrics, company-wise metrics, all you need to do is go back to the share icon, share this. Let's try this. So maybe let's do Revenue by Year. And we're doing sharing on Slack. Let's go back to the same Slack channel. All I see is this metadata, the revenue by year is shared. But wait for it. You also have data available here in case these are product metrics you want to share, right available right here on Slack. Makes it easy.
57:43 While your source of truth becomes your verified metric that you're creating dbt, but the collaboration happens across your data tools in Slack. Now, last but not the least, let's, let's close with that. I know we're two minutes out. Let's go back to Google Sheets again. And this time, we will bring in some other experience where we will start querying the dbt metric. As soon as I click that, all the metrics that you see on Atlan, all, all the metric that you verified on dbt, which is your semantic layer source of truth, you can click Revenue.
58:18 Again, bring it to your Google Sheets, collaborate, create your visualizations create your charts, share it with your org and start collaborating on data. So quick recap. And so Command+K discovery make it dead easy to find your metrics across your stack. Quick metric preview, exploration in case you want to you are curious and want to find more data, do more exploration. Save queries and share it on Slack. And last but not the least, bring it to Google Sheets so that you can create a charts, share with your colleagues. So on that note, I'm gonna just pass on back to Matt and Julie to close this.
Matt
59:01 Thank you very much, Varun. And it looks like we're over time, so we tried to answer as many questions as we could in the chat. Those we did not get to, we'll definitely reach out to you and get you the answers that you need or want. In the meantime, if you're interested in learning more about Atlan's integrations with Fivetran, Snowflake, and dbt, there's plenty of information we can provide in terms of links as well as press releases and blogs. So please feel free to check those out. And then finally, we just wanna thank everybody for taking the time out of their day to attend this webinar.
59:37 We also wanna thank our partners from Fivetran, dbt, and Snowflake for taking their time and the support that they've given to, to Atlan and the Atlan community over these last few months as well. We look forward to everybody's conversations moving forward, as well as a continued partnership. Thank you everybody, and have a great day.
Varun Banka
59:59 Thanks, everybody. Thanks for joining in.
Resources & Blogs


