Data products as a common language for governance
Live demos
Want to watch a live demo?
Atlan engineers bootstrap, test and deploy enterprise context on real data.
See it on your own data
Walk through how a context layer would work on your stack, with our team.
Talk to usAbout this session
10 min1 speaker
A nine-minute demo from Re:Govern 2024. It starts in Snowflake with the Atlan Chrome extension and an Atlan AI lineage summary, then moves to domains and data products, with access controls at domain level and sensitivity, freshness and criticality on each product.
Speakers
 Steven HlorosSenior Customer Education ManagerAtlan · Host
Full transcriptSearchable
Steven Hloros
0:03 So we're actually going to start today's demo with governance driving innovation via a common language. Now, you're gonna be asking, why start there? Well, at Atlan, we, we really care about the humans of data, and we recognize the challenges of hugely diverse data teams, technologies, legal and regulatory frameworks, you name it. Too often in the past, we've seen governance layered on top of these challenges, and it's an afterthought to just remove risk or, you know, prove compliance. But we believe that governance can be a driver for innovation because it's actually the connective tissue for data practitioners, whether they're engineers, stewards, analysts, or business users themselves.
0:54 Now, let's take a look at kind of a real-world example here. Let's pretend that I'm a finance analyst. I'm working on our cash flow analysis. It's a sensitive topic with complex and censored... Sensitive governed data behind it. How can I use Atlan's data domains and products? I'll actually start from Snowflake. Now, I'm digging into our orders data to align with our deposit data. My colleagues in data engineering pipe in some master tables into Snowflake. Now, I'm in finance, kind of technical, but not a Snowflake expert. I'll start by opening Atlan's Chrome extension.
1:38 This gives me a bit more context about this table so I can understand recent changes, ongoing conversations, and more. Now, if you haven't ever used Atlan before, this is the asset companion sidebar in the asset profile. Here we get a ton of metadata from ownership tags to even conversations about that asset itself. Now, I'm in the sales data with one end goal. I want to find the best source of truth to our sales data so I can match it with our cash flow and deposit data for audit purposes.
2:12 With the Atlan Chrome extension, I can get a sense of how to use this data, I can know if I can trust it with the certification, and I can even know who to reach out to when it comes to having any sort of questions. Now, if I want to dig in deeper to this, I'll go into the lineage so I can understand where this data comes from and where it actually goes to.
2:37 Now, as I traverse up and down this lineage graph and looking at kind of how complex it gets and taking a look at the different assets, one thing we can clearly see is the context around these additional assets is not there for me to understand. Well, instead of having to reach out to somebody in data engineering or maybe our Power BI owner to get that context I need, with a simple click with Atlan AI, I can get a two-sentence summary to give me that context to continue moving on. Now, as I go back and continue looking up and downstream as a financial analyst I'm noticing this is getting increasingly complex.
3:24 This is powerful, and it's incredible for a certain type of user. But for me, a finance analyst right now, it's not what I wanted. And this reflects a lot on legacy data governance tooling. Data might come from dozens of different connectors, from CRMs to data lakes, warehouses, ETL tools, BI tools, and so many more, scores of disparate asset types. And absolutely, data practitioners sometimes need this level of complexity. But our challenge here is we have to govern down to the individual table, report, and beyond.
4:09 And this visual alone tells us how this complexity can quickly spiral out of control. So today we're going to take a new approach. We will dive into our data products and domains, particularly discussing data products as a common language and how that fits into adaptive governance. Continuing as a financial analyst working on this cash flow analysis, I'm no longer gonna start at Snowflake or any individual data set, BI report, or even any asset. I'm starting from my team's data homepage. Now, right off the bat, we can tell this looks very different than that asset screen we were looking at before.
4:57 What we're seeing here is a reflection of our business's organization, not our data stack structure. And this is where governance comes in. Data governance is always doomed to be reactive if it's not innovating in parallel with the business it supports. And as data users across industries tackle their latest challenges, data products are critical solutions to connecting tangible business use cases with the complexity of data that flows into them.
5:31 And business domains, well, they are the critical governance aspect of this, and they allow this approach to be adaptive and reflect the needs of the business, whether that business is going no-holds-barred in a data mesh or they're easing into it with, you know, a federated structure coming from a central siloed data organization. Now, to start here, what I do know is this data is being governed for me. This is not some one-off report in a BI tool, a table in a warehouse, or an asset in a list of hundreds of different assets. It's an automated holistic view of how data works for my organization.
6:14 This actually shows me the data products, and we'll get into those in just a second, and those actually deliver business value. Now, if I go inside the finance domain, I can actually see things like automated activity and usage from others, and this has access controls at the domain and sub-domain level for the data products within it. So going back to being a finance analyst working on that cash flow, I'll actually jump into that data product. Now, what do we actually see here? Well, as we look, it's pretty clear on the business goal of this data product, along with the domain that it is part of.
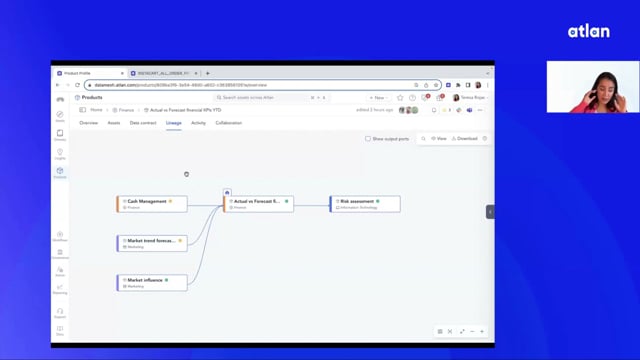
7:00 It's transparent on what it actually contains and how it can be consumed and used. I can see all of the different individual assets in this data product to understand that level of granularity if I actually need to, and I can manage how they're governed. We have output ports so I know how to actually consume this information and where to access it. On top of that, we even have business lineage showing me that this data product flows right into our expense forecasting models. Now, we've all essentially seen data projects, especially in data governance, get started and be slow to deliver value or drive adoption.
7:48 Here I have an automated way of this keeping the value add of the data product transparent, keeping my colleagues and I accountable rather than doomed to legacy governance patterns of shelf projects attracting dust. Fundamentally, it is an automated bridge between the complexity of data and the business deriving value from it. And we can see that in sections like the sensitivity, the freshness, and the criticality. Now, this is governance driving innovation via a common language. No more confusion over which data warehouse it's in, and no more wondering which report and which BI tool.
8:36 Data products exist to solve business needs. Now, let's recap what we just saw. Historically, data governance has struggled to bridge the gap between tangible business outcomes and the complex idiosyncrasies of individual data assets. Atlan's data products and business domains flip this on its head. Data analysts and engineering teams can now align with governance to drive innovation via common language, data products. The tooling syncs their initiatives with a shared language and shared output. And organizational leaders, well, they now have the flexibility with domains to automatically have data match their expectations for access control, compliance, and more.
9:25 In many ways, this can mirror real-world business operations.