


Why does AI observability matter for the enterprise?
Permalink to “Why does AI observability matter for the enterprise?”According to S&P Global Intelligence, 42% of companies abandoned most AI initiatives in 2025, up from 17% in 2024. An IDC research in partnership with Lenovo found that 88% of AI POCs didn’t get deployed at scale.
Organizations that managed to deploy AI at scale have had better foundations: data readiness, governance, metadata quality, and semantic clarity. Many allocated 50 to 70% of their AI budgets to these foundations before scaling any models.
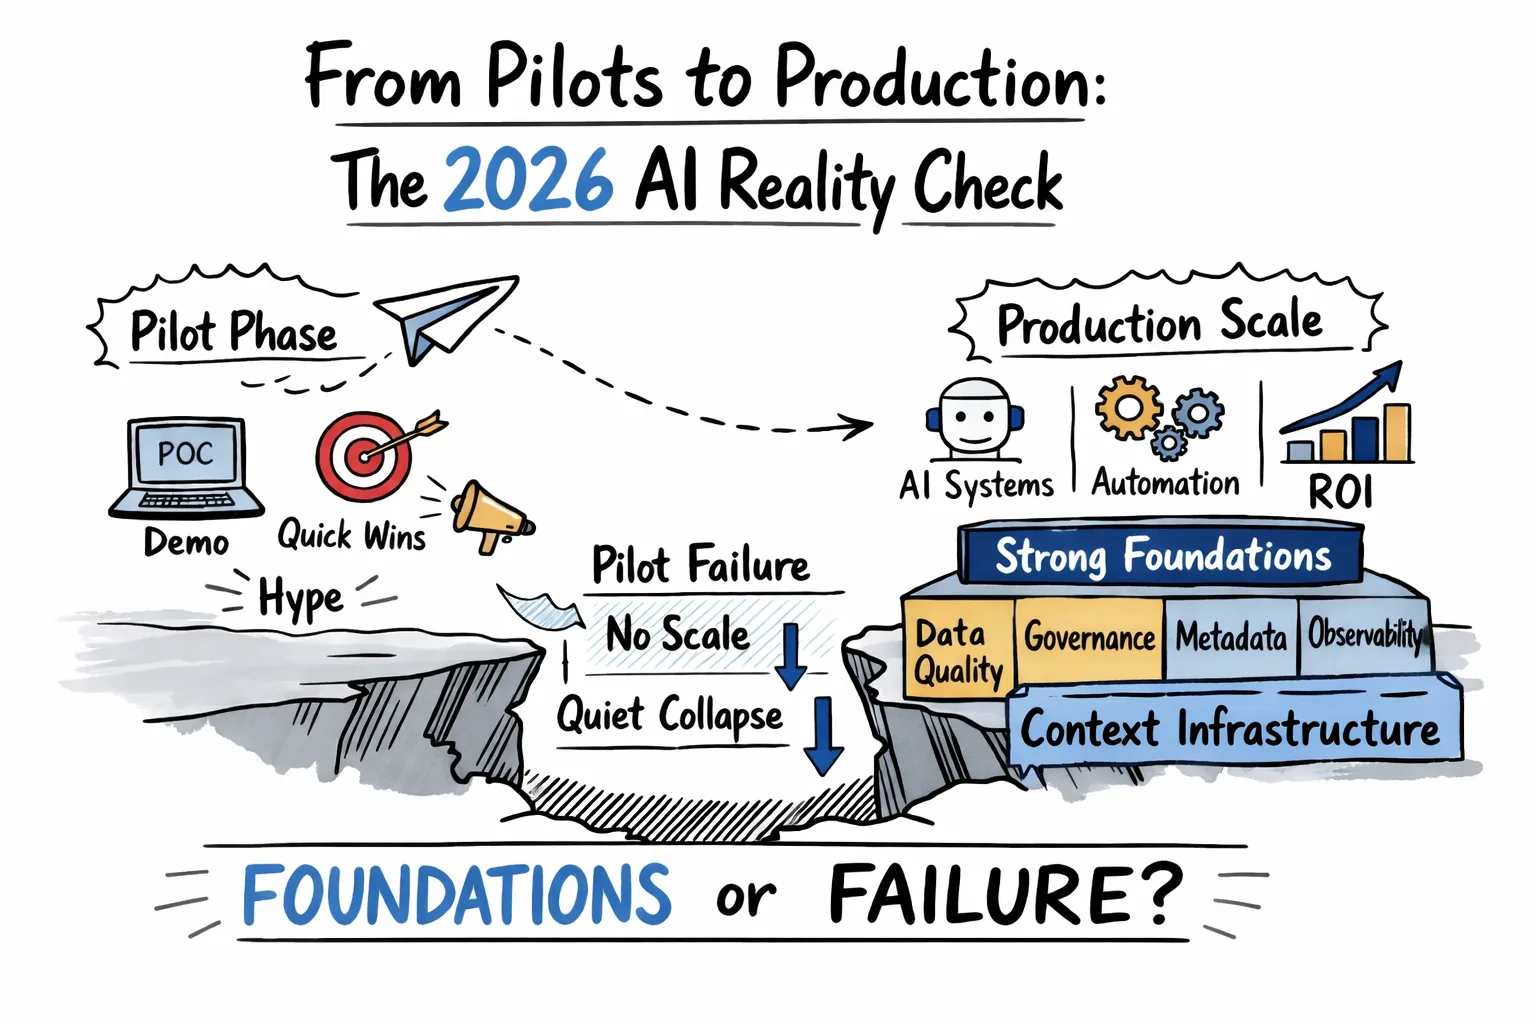
Why AI POCs fail in production. Source: Metadata Weekly
These projects fail because traditional monitoring isn’t enough to track how models use data, interpret prompts, or produce outcomes. Conventional monitoring cannot handle non-deterministic behavior, root cause complexity, or ROI and compliance pressure.
AI observability is the feedback mechanism that makes foundation investment actionable. It provides the visibility needed to distinguish between agent failure modes, driving root cause analysis, cost-per-call tracking, and audit trails mandated by regulatory frameworks.
How is AI observability different from monitoring?
Permalink to “How is AI observability different from monitoring?”Monitoring answers a binary question: is the system up or down? It checks predefined conditions and fires alerts when thresholds are crossed. Observability goes further and gives teams the ability to ask arbitrary questions about internal system state using the data the system emits.
For AI agents specifically, the distinction matters because the most dangerous failures are not binary. They are gradual, context-dependent, and often invisible to threshold-based monitoring.
How is AI observability different from data observability?
Permalink to “How is AI observability different from data observability?”Data observability was designed to answer one question: can we trust the data in our pipelines and dashboards? It tracks freshness, schema validity, volume, and distribution.
AI observability must go further. Three failure modes show why this gap is so dangerous:
- Silent statistical drift: A column passes every quality check, but the underlying distribution has shifted. The model makes systematically wrong predictions while all observability dashboards report green.
- Amplified historical bias: Pipelines are intact and data is accurate, but decades of biased decisions are encoded in training data. The model learns and amplifies those patterns.
- Context collapse: A RAG pipeline delivers fresh documents, but the agent misinterprets context or the documents reflect outdated business definitions.
What are the core components of AI observability?
Permalink to “What are the core components of AI observability?”AI observability operates across five distinct layers: logs, metrics, traces, context signals, and dynamic traces.
1. Logs: What happened
Permalink to “1. Logs: What happened”Logs capture the full record of every agent interaction, including the request that came in, the context that was retrieved, the tools that were called, and the response that was generated. In multi-step agent workflows, logs are the raw material for reconstructing exactly what occurred at each step and in what order.
2. Metrics: How it performed
Permalink to “2. Metrics: How it performed”Metrics track quantitative performance across the system. Core signals include latency, token cost, error rates, faithfulness scores, answer relevance, and retrieval precision. The standard instrumentation layer is OpenTelemetry, with purpose-built platforms including Arize AI, Langfuse, and Weights and Biases adding AI-specific evaluation on top.
3. Traces: How it got there
Permalink to “3. Traces: How it got there”Traces record the reasoning path an agent followed to reach an output. For multi-step workflows, a trace captures which tools were called and in what order, which documents were retrieved at each step, where the workflow branched or escalated, and what intermediate outputs were produced before the final response.
4. Context signals: What the agent knew
Permalink to “4. Context signals: What the agent knew”Context signals monitor the health of the knowledge infrastructure the agent consumed, below the inference layer, where standard observability tools have no visibility. Four signals matter most:
- Schema version staleness: How long since this schema was validated against upstream changes?
- Glossary definition age: When was this business term last reviewed, and who currently owns it?
- Lineage completeness: Are the lineage paths from agent-consumed data to source systems intact?
- Ownership freshness: Is each definition owned by an active stakeholder?
Atlan’s context drift detection framework identifies these four context signals to predict agent failures before they surface in inference metrics.
5. Decision traces: Why the agent acted
Permalink to “5. Decision traces: Why the agent acted”Decision traces capture the business reasoning layer that standard distributed traces miss entirely. For each agent output, a decision trace records: which governance policies were applied, which business rules constrained the available options, what exceptions were granted, which precedents the agent referenced, and what the agent’s stated reasoning was for reaching its conclusion.
The inference observability gap: What standard tools cannot see
Permalink to “The inference observability gap: What standard tools cannot see”Standard observability platforms can tell you what the agent received and produced, how long the response took, and whether the output was faithful to the retrieved context. They cannot tell you:
- Whether the retrieved schema reflected the current state of the source system
- Whether the business term in the retrieved document still has an active owner
- Whether the lineage path from the agent-consumed data to the source system is intact
- Whether the definition the agent cited was last reviewed before a major policy change
This is the inference observability gap. An agent that produces wrong answers despite near-zero error rates, a faithfulness score of 95%, and on-budget cost per query has a problem not at the inference layer — but in the stale definitions its metrics were built on.
The full AI observability picture
Permalink to “The full AI observability picture”Complete AI observability requires three tracks operating in parallel:
Inference observability covers what happened at the model layer. It catches performance degradation, cost overruns, error spikes, and faithfulness drops. Tools include Arize, Langfuse, Weights and Biases, LangSmith, and OpenTelemetry. Engineering teams own this layer.
Context observability covers what the agent knew. It catches schema staleness, glossary drift, lineage gaps, and ownership decay before they cause inference failures. Data and governance teams own context observability.
Decision traceability covers why the agent acted. It captures the governance and reasoning layer, including policies applied, precedents cited, and exceptions granted, and makes it queryable for audit and compliance purposes.
How to enable context observability and decision traceability with a sovereign context layer
Permalink to “How to enable context observability and decision traceability with a sovereign context layer”Most observability tools give engineering teams a clear view of the inference layer. What they cannot see is the context layer — the quality, freshness, and governance status of what the agent knew when it produced that output.
Atlan fills this gap with a metadata lakehouse, MCP-compatible servers, and a sovereign context layer.
Atlan’s Metadata Lakehouse unifies asset metadata, lineage, quality, policies, usage, and AI assets into an open, Iceberg-based store serving humans and agents alike. Atlan’s MCP Server exposes this governed context to agent frameworks, while Atlan’s AI Governance registers models and agents, ties them to lineage and policies, and tracks runtime behavior as a first-class governance function.
Atlan’s Context Engineering Studio provides the infrastructure for context observability: governed definitions, active lineage, ownership tracking, and drift detection across every asset an agent consumes.
Together, these capabilities help enterprises build a complete observability picture across all three tracks: inference, context, and decision tracing.
Real stories from real customers: Building enterprise context layers for successful AI at scale
Permalink to “Real stories from real customers: Building enterprise context layers for successful AI at scale”"Atlan captures Workday's shared language to be leveraged by AI via its MCP server. As part of Atlan's AI labs, we're co-building the semantic layer that AI needs."
Joe DosSantos, VP Enterprise Data & Analytics
Workday
Workday: Context as Culture
Watch Now"Atlan is our context operating system to cover every type of context in every system including our operational systems. For the first time we have a single source of truth for context."
Sridher Arumugham, Chief Data Analytics Officer
DigiKey
DigiKey: Context Operating System
Watch NowMoving forward with AI observability
Permalink to “Moving forward with AI observability”The teams making real progress on AI observability in 2026 share one characteristic: they treat it as infrastructure, not instrumentation. They build observability into the design of the agent system from the start, connecting inference monitoring to context monitoring to decision traceability before the first production query runs.
Atlan’s Context Engineering Studio provides the context layer infrastructure that makes the second and third observability layers operational. The inference layer tells you your agent is wrong. The context layer tells you why.
FAQs about AI observability
Permalink to “FAQs about AI observability”1. What is the difference between AI observability and AI monitoring?
Permalink to “1. What is the difference between AI observability and AI monitoring?”Monitoring checks predefined conditions against known thresholds and alerts when they are breached. It is a passive, reactive system. Observability is the capacity to ask arbitrary questions about system state from the data the system emits. In AI systems, this distinction matters because the most dangerous failures are not threshold violations. They are gradual, context-dependent degradations that require exploratory investigation to diagnose, not just dashboard checks.
2. What are the three pillars of observability in AI systems?
Permalink to “2. What are the three pillars of observability in AI systems?”The three classical pillars of observability — logs, metrics, and traces — apply to AI systems with specific extensions. Logs capture request-response pairs including retrieved context. Metrics track accuracy, latency, token cost, and error rates. Traces record the multi-step reasoning paths that agents follow across complex workflows. A fourth pillar, context signals, covers the health of the metadata and definitions the agent consumed, a layer that classical observability frameworks were not designed to address.
3. What is a faithfulness score, and why is it not enough on its own?
Permalink to “3. What is a faithfulness score, and why is it not enough on its own?”A faithfulness score measures whether an agent’s output is grounded in the context it retrieved. A score of 95% means 95% of the response is supported by the retrieved documents. It does not measure whether those documents were accurate, current, or consistent with the organization’s current understanding of a topic. An agent can score 95% faithfulness while systematically reporting outdated business definitions. Faithfulness should always be paired with context staleness monitoring to be meaningful.
4. What tools are used for AI observability?
Permalink to “4. What tools are used for AI observability?”The standard instrumentation layer is OpenTelemetry, which provides a vendor-neutral framework for emitting traces and metrics across any AI stack. Purpose-built platforms include Arize AI for production LLM monitoring and evaluation, Langfuse for open-source tracing and evaluation, Weights and Biases for experiment tracking and model monitoring, and LangSmith for LangChain-based agent tracing. None of these platforms natively monitor the context layer that sits below retrieval.
5. What is context drift, and how does it affect AI agents?
Permalink to “5. What is context drift, and how does it affect AI agents?”Context drift occurs when the metadata, definitions, or lineage feeding an agent goes stale, inconsistent, or misleading at the data layer, before any model runs. It is distinct from model drift, which describes degradation in model performance, and data drift, which describes shifts in input distribution. Context drift explains why agents that are performing correctly on all inference metrics can still produce wrong business answers.
6. What are decision traces, and who needs them?
Permalink to “6. What are decision traces, and who needs them?”Decision traces are structured records of an agent’s business reasoning, covering what policies it applied, what precedents it referenced, what exceptions it granted, and what escalation paths were available. Unlike inference traces, which capture system performance, decision traces capture the governance layer. They are the observability artifact that legal, compliance, and internal audit teams require for regulatory examination.
7. How is AI observability connected to AI governance?
Permalink to “7. How is AI observability connected to AI governance?”AI observability and AI governance are mutually dependent. Governance defines the policies, ownership structures, and accountability requirements that agents must operate within. Observability provides the evidence that those requirements are being met in production. Without observability, governance exists only as documentation. Without governance, observability generates signals with no policy framework to interpret it against. Decision traces are the specific artifact where the two capabilities converge: they record governance in action, query by query.
