

Lightdash is an open-source, dbt-native BI platform for analytics engineers who already define metrics and models in dbt. It reads dbt models and metric definitions directly, so a team doesn’t redefine the same business logic in a second tool. As of 18 September 2026 the project has 6,142 GitHub stars and 778 forks, with a core that’s MIT-licensed. This page covers what the product does today, its license structure, how it connects to dbt, and who it fits.

Most write-ups of Lightdash still describe it as it looked in 2022 and 2023: a dbt-native dashboard tool, full stop. Since 2025, it’s been building toward what it calls “Agentic BI,” adding AI agents with MCP support and orchestration for tracking and reverting automated runs.
- dbt-native metrics. Reads models and metric YAML directly from a connected dbt project
- Open-core licensing. MIT for the core, a separate license for the enterprise-tier
ee/directory - Dashboards, exploration, and SQL Runner. The BI layer built on top of those metrics
- AI agents with MCP support. New since 2025, on the Cloud Pro and Enterprise plans, not the free self-hosted tier
Below: what Lightdash is today, its license, dbt relationship, permissions, how it compares to Looker, Metabase, and Tableau, who it fits, and where Atlan fits around it.
| What it is | Open-source, dbt-native BI platform for analytics engineers |
| License | MIT for the core; the ee/ enterprise directory carries a separate license, so it isn’t fully open source end to end |
| Pricing | Open Source is free and self-hosted; Cloud Pro is $3,000/month; Enterprise is custom, per Lightdash’s pricing page |
| Core components | Dashboards, exploration, SQL Runner, dbt-native metrics, AI agents (paid tier) |
| Best for | Teams already running dbt with tested, well-defined models |
| Known limitation | dbt MetricFlow support is beta with partial metric-type coverage; row/column security is attribute-based and self-configured, not automatic |
Your dbt models feed more than one BI tool
See how a context layer connects the same dbt metric definitions to every downstream tool, Lightdash included.
Get the Context Layer EbookWhat is Lightdash? From dbt dashboard tool to agentic BI
Lightdash today is a broader product than most explainers describe: a dbt-native BI platform that has spent 2025 and 2026 adding AI agents on top of its original dashboard and exploration layer, with 6,142 stars, 778 forks, and 929 open issues on its GitHub repository as of 18 September 2026.
The core pitch hasn’t changed since launch. Lightdash reads models and metric definitions directly from a connected dbt project, so an analytics engineer defines a metric once, in dbt, and every dashboard built on top of it inherits the same logic. No parallel modeling layer, no re-implementing business rules in a second tool.
What’s newer is the shift toward what Lightdash calls “Agentic BI.” The product now ships AI agents that answer natural-language questions against governed metrics, with MCP support so external agent frameworks can query Lightdash as a tool, plus orchestration for tracking and reverting agent actions. That’s a meaningfully different surface than the dashboard tool most “what is Lightdash” content still assumes.
What the repo says it is now
The clearest evidence of the shift is the repository description itself, which now reads “Agentic BI. Analytics at the speed of code,” with a README that opens “Open-source Agentic BI for modern data teams.” Two years ago the same repo described a dbt-native dashboard tool.
The practical implication: check the current docs before trusting an older comparison post. The product underneath Lightdash’s name has moved substantially since most existing “what is Lightdash” content was written.
Is Lightdash actually open source?
Mostly, with a caveat almost no existing explainer states plainly: yes for the core, no for everything Lightdash ships.
The core platform is MIT-licensed and self-hostable. You can run it on your own infrastructure at no license cost, inspect the source, and modify it under standard MIT terms. That part of the “open source” claim is accurate and verifiable directly against the repository’s license file.
The part that gets left out is the packages/backend/src/ee/ directory: Lightdash’s enterprise-edition code, carved out under a separate license from the MIT core. The license file says so directly, and GitHub itself classifies the repository as NOASSERTION, “Other”, rather than MIT, because of that carve-out. A team can self-host the open-source build, but the features living in ee/ aren’t part of that grant. “Open source” needs this qualifier, and it only shows up if you read the license file rather than the marketing copy.
One related tradeoff: Lightdash’s pricing table puts the MCP server and AI agents on the Cloud Pro and Enterprise plans. Open Source gets “Access to Lightdash OSS only”, plus Google-only SSO, three days of version history and community-Slack support. If the agent surface is why you’re looking at Lightdash, self-hosting alone won’t get you there; Cloud Pro is $3,000 a month. That’s a common shape of problem across open-core BI generally: a tool is genuinely open source, while the feature that differentiates it commercially sits behind a separate license or a hosted-only tier.
How does Lightdash work with dbt?
Lightdash gets metric definitions from dbt through two separate paths, and conflating them is the single most common inaccuracy in existing coverage of the product.
Lightdash’s own metrics YAML (meta.metrics)
The primary, mature path is Lightdash’s own meta.metrics specification: a YAML block added directly to your dbt models. This is what “dbt-native” has meant for Lightdash since launch, and it’s the path most deployments actually use.
The MetricFlow integration, and its beta limits
Separately, Lightdash can pull metrics from dbt’s own official semantic layer, MetricFlow. Lightdash’s own dbt MetricFlow integration reference labels this integration beta, and the limitation list is specific: only simple, ratio, and derived metric types pass through, same-model only. cumulative and conversion metrics aren’t supported, cross-model ratio or derived inputs get skipped entirely, and so do offset_window and offset_to_grain inputs, cross-model or non-Dimension() filter templates, agg: percentile without a numeric percentile, percentile_type: discrete, and join_to_timespine, fill_nulls_with and non_additive_dimension.
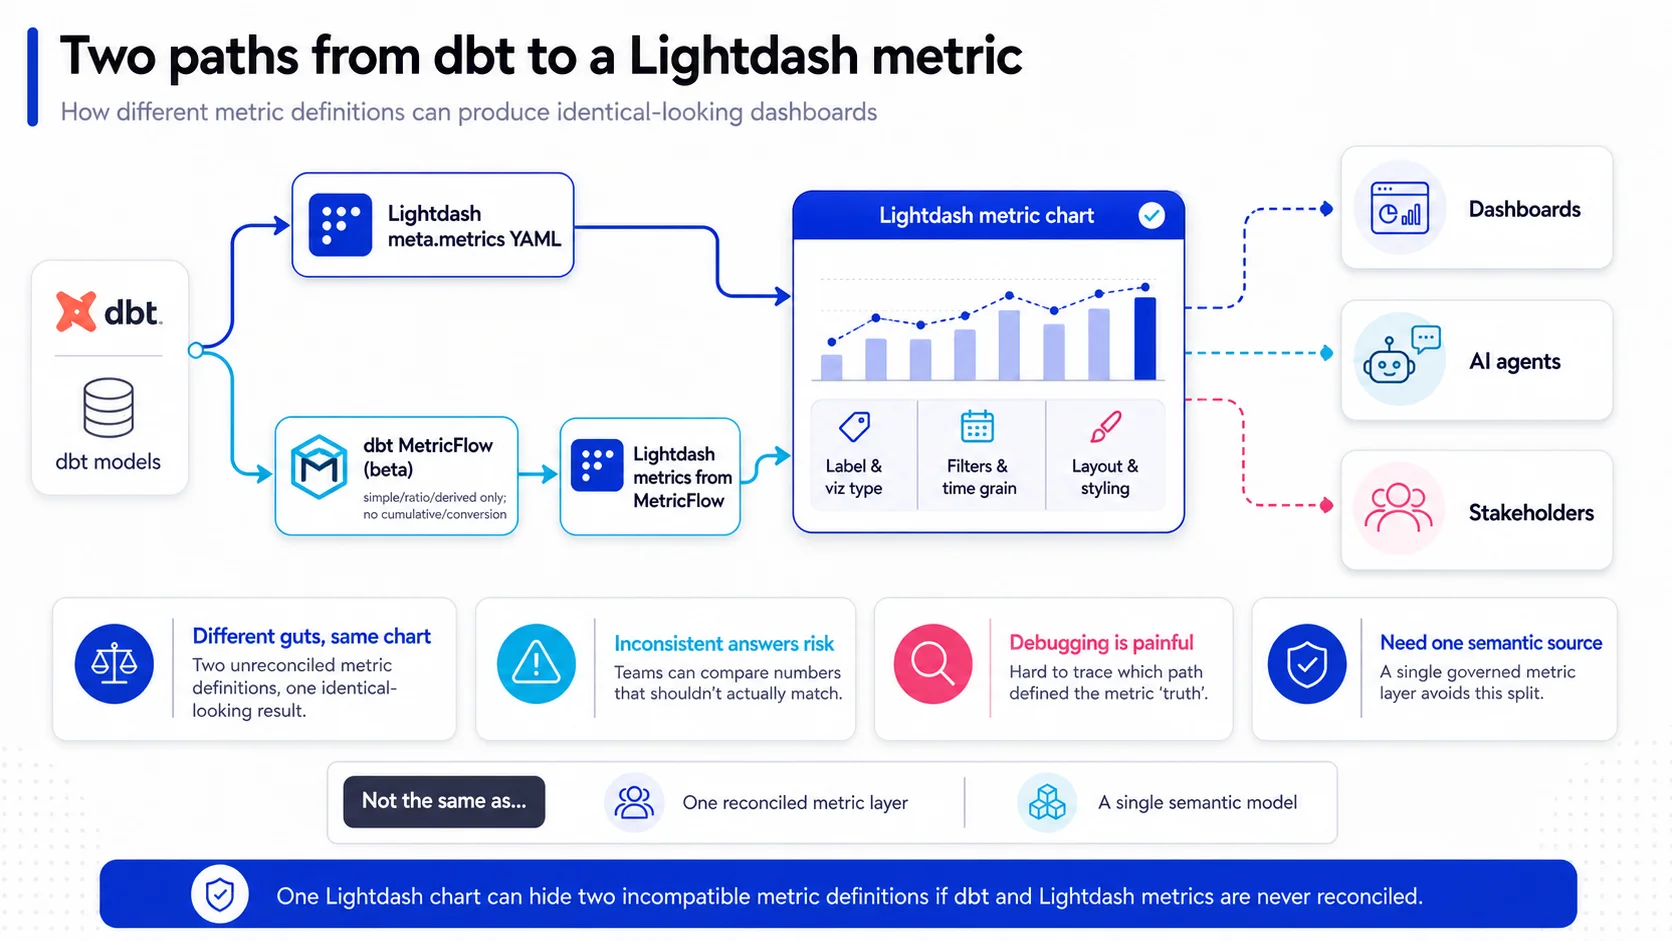
One Lightdash chart can hide two incompatible metric definitions if dbt and Lightdash metrics are never reconciled. Source: Atlan.
Here’s the nuance that gets lost when people say Lightdash is “dbt-native”: that phrase and “uses the dbt Semantic Layer” are not the same claim. Since the two paths coexist rather than one replacing the other, a team could plausibly end up with a metric defined in Lightdash’s own YAML and, separately, a related metric defined again in MetricFlow on the dbt platform, without anyone deciding that on purpose. It’s a smaller-scale version of a problem that isn’t unique to Lightdash: any BI tool that builds its own metrics layer alongside a second, standards-based one has to actively reconcile them, because nothing does it automatically.
What can you build in Lightdash?
However a given metric got defined, Lightdash’s product surface has three layers built on top of it: a BI layer for business users, a query layer for analysts, and, since 2025, an agent layer for natural-language questions.
Dashboards and exploration
The BI layer is dashboards and self-serve exploration for business users who need answers without writing queries. Because both build directly on dbt-defined metrics, a chart’s logic traces back to one YAML definition rather than a chart-specific calculation buried in the visualization tool.
SQL Runner
For analysts who want to drop below the semantic layer, SQL Runner gives direct query access against the warehouse, alongside the metrics layer rather than replacing it.
AI agents and MCP support (Cloud Pro and Enterprise only)
The newest layer is AI agents: natural-language queries against governed metrics, with MCP support so external agent frameworks can call Lightdash as a tool rather than scraping a dashboard. Both sit on the Cloud Pro and Enterprise plans. Lightdash has also been building agent orchestration, tracking and reverting the actions an agent takes, which matters once an agent can do more than answer a question. All of this is organized into Spaces at the project or workspace level, which doubles as the unit access gets managed at.
Three product layers, one underlying metric source, at least in principle: Lightdash’s agents, dashboards, and SQL access all read from the same dbt-defined metric. The caveat is that “the same metric” can itself mean either of two definitions, depending on which of Lightdash’s two metric paths produced it.
How does Lightdash handle permissions and governance?
Lightdash’s permission model has two separate layers, and the one most teams evaluate it on (feature access) is the one that comes configured by default; the other (data access) has to be built by hand.
Access is managed through Organization and Project roles plus Space-level access: who can open SQL Runner, who can use AI agents, who can view or edit a given dashboard. That layer works out of the box.
Row- and column-level security also exists, but it isn’t automatic. Lightdash supports it through user attributes: an admin defines a text attribute per user or group (say, sales_region), then references it in a dbt model with sql_filter for row filtering or required_attributes for column filtering, using the ${lightdash.attributes.sales_region} syntax. The filter runs on the warehouse itself, so it can’t be bypassed from the UI, unlike a chart or dashboard filter, which the docs are explicit isn’t a security boundary since any editor can remove one. The catch: nothing restricts data by default. Until someone writes those sql_filter rules into the models, everyone with dashboard access sees the same underlying rows and columns. Teams evaluating Lightdash for compliance-sensitive data, healthcare records, SOX-controlled financial data, anything with a regulatory access requirement, need to budget for that setup work rather than assume role-based permissions cover it.
| Permission type | What Lightdash controls | Configured by default? |
|---|---|---|
| Feature access | SQL Runner, AI agents, dashboard editing | Yes, via Organization/Project roles |
| Space access | Who can view or edit a given Space’s dashboards | Yes |
| Row-level security | Which rows of underlying data a user can see | No, requires sql_filter + user attributes per model |
| Column-level security | Which columns of underlying data a user can see | No, requires required_attributes per model |
Feature-level permissions answer “can this person open this tool,” and role setup handles that automatically. Data-level security answers “can this person see this row or column,” and that one is a modeling task, not a settings toggle. The two are easy to conflate, and only the first comes free with the product.
Know where your context maturity actually stands
Run a quick assessment of how well your dbt models, BI layer, and access controls currently stay in sync before you add another tool to the stack.
Take the AssessmentLightdash vs. Looker vs. Metabase vs. Tableau: how do they compare?
Lightdash competes with Looker, Metabase, and Tableau, but the comparisons that matter come down to where each tool’s business logic lives, not a feature checklist.
Against Looker, the consistent framing across independent sources is “open-source Looker alternative.” Both center business logic in a dedicated metrics layer, but the layer lives in different places: Looker’s in LookML, which only Looker authors and compiles, and Lightdash’s directly in dbt, where other tools that read the same project can reuse it. Google does expose LookML models to third-party tools, over JDBC through the Open SQL Interface and to agent clients through a Looker-managed MCP server, so the difference is where the definition is written, not whether anything else can read it.
Against Metabase, the split is audience, not raw capability: Metabase for non-technical self-serve out of the box, Lightdash trading some of that immediacy for dbt-native governance. Without dbt, comparisons describe it as a thinner Metabase.
Against Tableau, the difference is mostly category and buyer. Tableau is an enterprise BI incumbent with a mature visualization story and, since Tableau Semantics shipped a Desktop connector in the 2025.2 release, a semantic layer of its own. Lightdash is newer, dbt-native, open-source at the core, and aimed at a narrower, more technical buyer.
None of these three comparisons touch the deeper issue Forrester analyst Boris Evelson documented in 2021: 61% of organizations use four or more BI platforms, and 25% use ten or more. A single dbt-native metrics layer, however well built, only governs the tools that read from it, not the other nine a typical enterprise is also running.
| Tool | Built on | Best for | Self-host option |
|---|---|---|---|
| Lightdash | dbt models and metric YAML | dbt-committed analytics engineering teams | Yes (MIT core) |
| Looker | LookML | Enterprise teams standardized on Google Cloud | No |
| Metabase | Its own query builder | Non-technical, self-serve business users | Yes (open source core) |
| Tableau | Tableau Semantics, on Tableau’s own data engine | Enterprise visualization at scale | No |
That multi-tool reality raises a separate question this page isn’t the place to settle: how Lightdash’s own metrics layer stacks up against a dbt-native semantic layer and a context layer governing across tools. The companion comparison covers that argument in full; this page stays at the category level on purpose.
Who is Lightdash built for?
Lightdash fits a specific team profile well, and the honest version of “who it’s not for” gets left out of most vendor-adjacent coverage.
It fits teams already running dbt with tested, well-defined models. Practitioner framing describes this as the most friction-free path to a BI layer, since the team inherits that modeling context automatically with no migration of business logic into a second tool.
It’s weaker for a few situations: teams without a dbt project, who end up closer to a thinner Metabase; teams wanting non-technical, out-of-the-box self-serve, better served by Metabase directly; and teams needing row- or column-level data security without the time to configure it, since Lightdash requires writing sql_filter and required_attributes rules into dbt models rather than flipping a setting.
Sizing note: Lightdash suits analytics-engineering-mature teams, not organizations buying their first BI tool. If dbt modeling discipline doesn’t already exist on your team, that’s the prerequisite to solve first.
How Atlan connects to the dbt and BI ecosystem
Atlan ingests the same dbt models and semantic definitions that BI tools like Lightdash consume, and layers on lineage, ownership, and trust signal so every tool asking about a metric gets the same answer back.
That’s not a Lightdash-specific integration; it’s the same “sits underneath and across BI tools” relationship Atlan has with any dbt-connected BI layer, documented on Atlan’s dbt partner page and its dbt integration overview. Atlan’s semantic layer tools guide classifies BI-native tools like Lightdash as one layer in a stack that also includes pure semantic layers (MetricFlow, Cube) and, above both, a context layer governing metric meaning for the AI agents now querying all of it.
See Atlan governing metrics across BI tools
Watch a live walkthrough of how Atlan keeps lineage, ownership, and trust signal consistent across every BI tool and AI agent that touches the same dbt metric.
Watch Atlan in ActionIf you’re weighing Lightdash against a dbt-native semantic layer and a governed context layer above both, the companion comparison page goes deep on that question. This page’s job is accuracy about Lightdash itself.
The three things that decide if Lightdash fits your stack
Strip away the marketing language and Lightdash comes down to three practical facts that most existing coverage states incompletely, if at all.
First, “open source” means the core, not the whole product: the MIT license covers a genuinely useful, self-hostable BI platform, but the ee/ directory sits outside that grant, and the MCP server and AI agents sit on Cloud Pro and Enterprise. Second, “dbt-native” has meant Lightdash’s own meta.metrics YAML since launch, and that’s still the primary path; MetricFlow support is a beta, partial addition, not a replacement. Third, role-based permissions here are about feature access, and they work automatically; row- and column-level security is a separate layer that also exists, but only once someone writes the sql_filter rules that turn it on.
None of that makes Lightdash a bad fit for dbt-committed analytics engineers who want their metric logic to live in one place, across dashboards, SQL Runner, and AI agents. It does mean that “one place” is Lightdash’s place, and most enterprises run several BI platforms at once. A single well-governed tool doesn’t extend that governance to whichever other platforms the rest of the organization is also running.
FAQs about Lightdash
1. Is Lightdash open source?
The core platform is open source under the MIT license and can be self-hosted for free. The ee/ directory, which carries enterprise-tier features, ships under a separate license. So Lightdash is open source for its core BI functionality, but not end to end.
2. Does Lightdash require dbt?
Not strictly, but it’s built around it. Its main value, defining a metric once and reusing it everywhere, depends on dbt models and metric YAML. Without dbt, independent comparisons describe it as functioning like a thinner Metabase.
3. How is Lightdash different from Looker?
Both center business logic in a metrics layer, but the layers live in different places. Looker’s logic is written in LookML, which only Looker authors and compiles, though Google exposes the compiled models to other tools over JDBC and MCP. Lightdash’s logic lives in dbt itself, so the same definitions can serve any tool reading that project.
4. Can I self-host Lightdash?
Yes. The MIT-licensed core is self-hostable, with setup documentation for running it on your own infrastructure. The MCP server and AI agents sit on the Cloud Pro and Enterprise plans, so they are not part of the free self-hosted build.
5. What is the Lightdash semantic layer?
It’s actually two separate things. Lightdash’s own meta.metrics YAML spec is its primary, mature metric layer. Separately, it can consume dbt’s official MetricFlow metrics, but that integration is beta and only supports simple, ratio, and derived metric types.
6. How do you define metrics in Lightdash?
Most teams define metrics in Lightdash’s meta.metrics YAML alongside their dbt models, the fully supported path. A smaller set pull metrics from MetricFlow instead, though that path currently skips cumulative and conversion types.
7. Is Lightdash better than Metabase for small teams?
Whether Lightdash beats Metabase comes down to whether the team already runs dbt. With mature dbt models, Lightdash tends to win on governance and setup speed. Without dbt, Metabase’s out-of-the-box self-serve experience is the easier start.
Sources
- lightdash/lightdash, GitHub
- Lightdash LICENSE file, GitHub
- Self-Host Lightdash, Lightdash Docs
- dbt MetricFlow Integration Reference, Lightdash Docs
- Roles and Permissions Reference, Lightdash Docs
- User Attributes Reference, Lightdash Docs
- Lightdash pricing
- About the dbt Semantic Layer, dbt Labs
- Open SQL Interface, Google Cloud
- Looker MCP server, Google Cloud
- Tableau Semantics, Tableau
- The BI Fabric Baby Is Slowly But Surely Growing Up, Forrester
