

LookML is the modeling language Looker uses to define dimensions, measures, and relationships as version-controlled code that your team’s queries inherit automatically, and Atlan is the context layer that connects those definitions back to warehouse lineage once they leave Looker. LookML shipped with Looker years before “semantic layer as code” became the industry’s phrase for it, and according to Google Cloud’s own internal testing, LookML-governed queries cut gen-AI natural-language query errors by as much as two-thirds compared with querying raw warehouse tables directly. This piece covers what LookML actually does, how it stacks up against newer semantic-layer-as-code tools like dbt and Cube, and where practitioners say it falls short.

LookML predates most of the vocabulary now used to describe it. Looker built the language to solve one specific problem: analysts kept writing the same metric five different ways in five different queries, and nobody could tell which version was correct.
- A modeling language, not a BI tool. LookML lives inside Looker, not a separate product you buy or install.
- Version-controlled by default. LookML files live in Git, so a metric’s definition goes through the same review process as application code.
- Translated into SQL at query time. Looker’s SQL generator turns a LookML model, plus a user’s selections, into the query that runs.
- An early “semantic layer as code.” LookML shipped years before dbt’s Semantic Layer and Cube popularized that exact phrase.
- Readable from outside Looker. The Open SQL Interface exposes LookML models over JDBC to third-party tools, provided the project runs on a BigQuery connection.
| Field | Content |
|---|---|
| What it is | The language Looker uses to define semantic data models, dimensions, measures, and relationships, as version-controlled code (Google Cloud) |
| Key benefit | Looker’s internal testing found LookML-governed queries cut gen-AI data errors by as much as two-thirds versus raw tables |
| Best for | Teams standardizing metric definitions across Looker dashboards and Explores |
| Origin | Shipped with Looker, years before dbt revamped its own Semantic Layer with MetricFlow at Coalesce 2023 |
| Core components | Views, dimensions, measures, joins, Explores, models, Persistent Derived Tables |
One context layer, every metric definition
LookML is one of several places a metric definition lives today. The AI Context Stack shows where semantic layers like LookML fit relative to the warehouse, the catalog, and the agents querying both.
Get the AI Context StackWhat is LookML?
LookML is Looker’s modeling language for turning raw tables into reusable dimensions, measures, and relationships. According to Google Cloud’s own documentation, LookML is “the language that is used in Looker to create semantic data models,” used to describe dimensions, aggregates, calculations, and data relationships in a SQL database.
That definition matters more than it sounds like it should. A dimension is a column or a simple transformation of one, something you can group by. A measure is an aggregation, a sum, count, or average, computed across rows. LookML separates the two explicitly, which is the mechanical reason a LookML model stays consistent no matter which Explore or dashboard queries it.
LookML files live in Git, and teams review and version changes to them the same way they would a pull request against application code. That is the DRY principle (don’t repeat yourself) applied to metric definitions: write the calculation once, in one file, and every query that needs it references the same source instead of re-deriving it.
One scope note worth settling early: LookML is not Looker Studio, the separate, free Google reporting tool formerly called Google Data Studio. Looker Studio cannot author LookML, though its Looker connector does read LookML-defined Explores, one Explore per data source. The naming overlap causes real confusion, and it comes up again in the FAQ below. LookML’s actual counterpart is the semantic layer concept itself, not any particular reporting front end.
LookML answers “what does this metric mean” once, inside Looker. It does not answer what happens when a dbt model, a spreadsheet, and a Looker Explore all claim to define the same number differently, a scope limit worth keeping in mind for the rest of this explainer.
How does LookML work in Looker?
LookML works by translating version-controlled model files into the SQL that Looker’s Explore interface runs against the warehouse. Three LookML object types do the actual work: views, Explores, and models.
1. Views: dimensions and measures
A LookML view defines the individual fields, dimensions and measures, that map to columns or calculations on an underlying table. One view typically corresponds to one table or one well-defined slice of a table, and it is where a metric’s actual formula lives, once, instead of once per report.
2. Explores: joins and the SQL generator
An Explore assembles one or more views into a queryable model through joins, and it is what a business user actually opens inside Looker. Google’s documentation describes LookML as the declarative language for defining dimensions, measures, and joins; when a user makes selections in the Explore interface, Looker’s SQL generator turns the LookML model plus those selections into SQL. That translation step, LookML plus user clicks in, real SQL out, is the entire mechanism.
3. Models and Persistent Derived Tables
Models group related Explores together and control which ones a given team or role can see. Persistent Derived Tables (PDTs) pre-compute expensive joins or aggregations so a dashboard does not re-run the same heavy query on every load, a benefit covered in more depth below.
| Aspect | Ad hoc SQL reporting | LookML semantic modeling |
|---|---|---|
| Metric definitions | Redefined in every query or dashboard | Defined once, reused across every Explore |
| Version control | Rarely tracked | Git-based, version-controlled by default |
| Consistency | Prone to drift between reports | Enforced through shared views and models |
| Governance | Manual review, if any | Centralized in LookML files |
| AI/agent readiness | Raw tables only, error-prone for natural-language queries | Cuts gen-AI query errors by up to two-thirds (Google Cloud, 2025) |
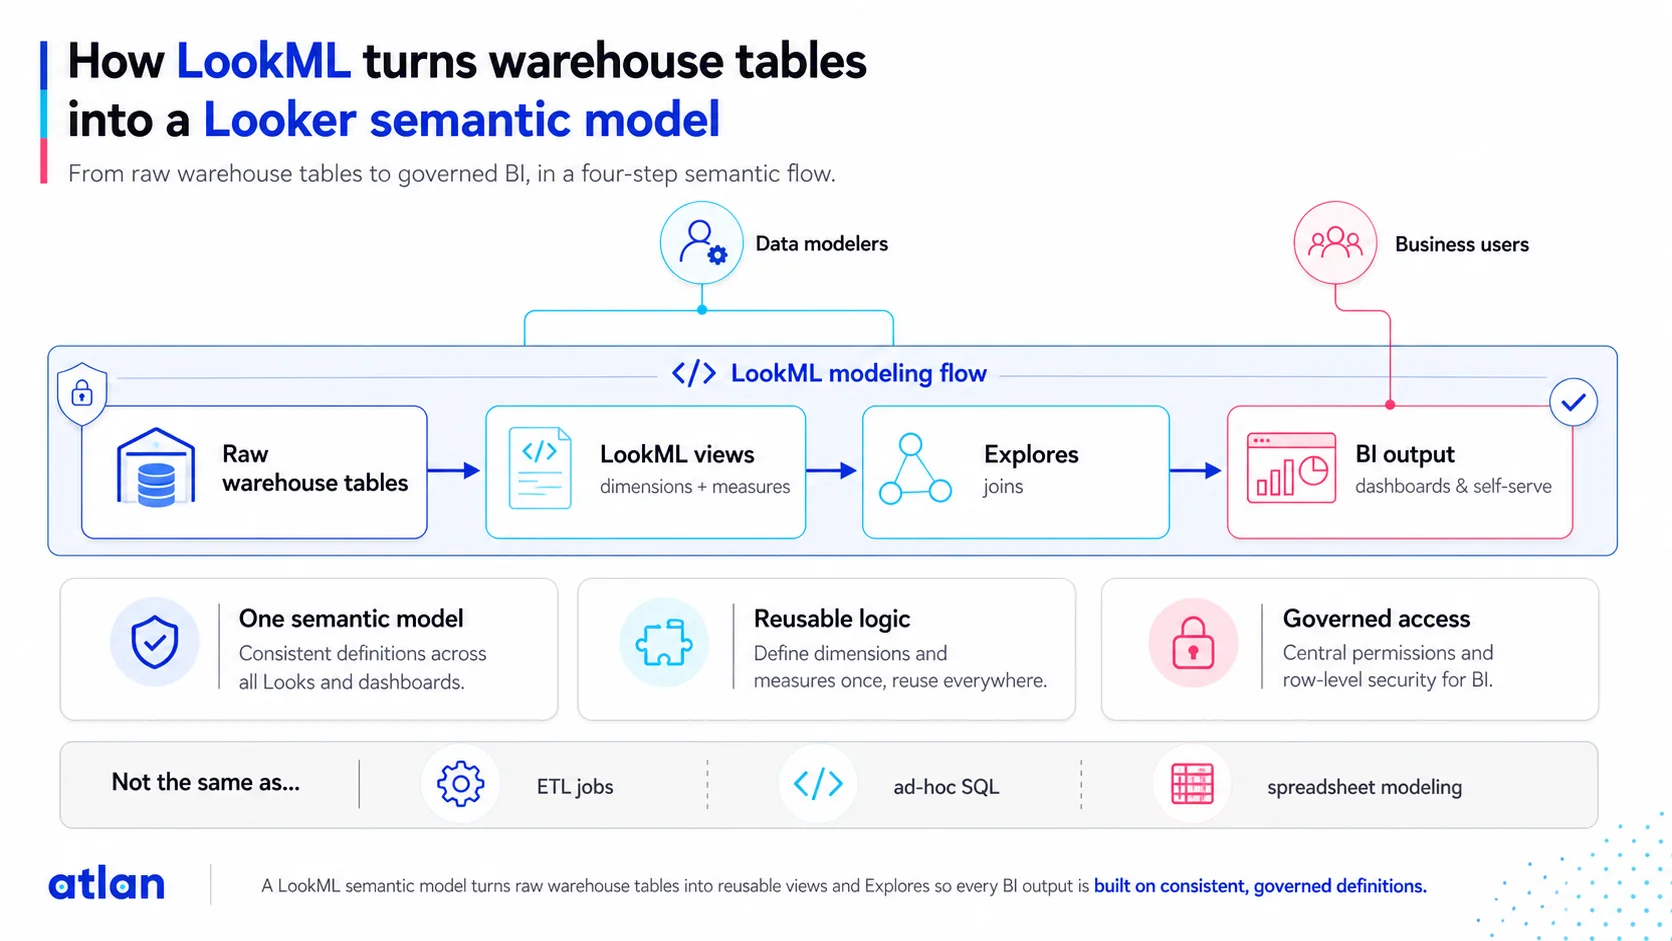
A LookML semantic model turns raw warehouse tables into reusable views and Explores so every BI output is built on consistent, governed definitions. Source: Atlan.
The mechanism itself is genuinely well designed: one file, reviewed like code, drives every query downstream of it. What it cannot do on its own is tell a reader whether that same metric is defined the same way in the other tools their organization also runs on top of the same warehouse tables.
Is LookML a semantic layer?
Yes, and it is one of the earliest mainstream implementations of the idea. Google’s own documentation calls LookML “the language that is used in Looker to create semantic data models,” and it shipped years before “semantic layer as code” became the phrase everyone reached for.
Google’s seam for getting that model out of Looker is the Open SQL Interface, which “provides access to the LookML models to any third-party application that supports Java Database Connectivity (JDBC).” The docs name Tableau, ThoughtSpot, Power BI, Looker Studio and Microsoft Excel as applications that connect to a LookML model as if it were a database. One constraint runs through all of it: the LookML project has to use a BigQuery connection.
| Tool | Origin | Approach |
|---|---|---|
| LookML (Looker) | Shipped with Looker, years before the phrase existed | Semantic layer defined as version-controlled code inside the BI tool, readable over JDBC |
| dbt Semantic Layer / MetricFlow | Revamped with MetricFlow, unveiled at Coalesce 2023 | Semantic layer as code, decoupled from any single BI tool |
Readers who want the fuller three-way breakdown of how LookML, Lightdash, and the dbt Semantic Layer compare against a governed context layer can find it in a dedicated comparison.
LookML earned the “semantic layer as code” label before the rest of the industry started using that phrase. What the label does not settle is whether the number LookML produces agrees with the one another tool produces from the same warehouse tables.
Same metric, five different answers?
If LookML, dbt, and a dashboard tool define the same metric three different ways, the Context Gap Calculator shows how much that drift is actually costing your team.
Try the Gap CalculatorWhat are the benefits of using LookML?
LookML’s main payoff is consistency: one definition of a metric that every Explore and dashboard inherits, plus measurable gains in query performance and AI accuracy. Instead of a metric getting redefined slightly differently in ten dashboards, it gets defined once, reviewed once, and reused everywhere.
That consistency has a measurable AI accuracy benefit, too. According to Richard Kuzma and Jesse Sherb (Google Cloud, 2025), Looker’s internal testing found that its semantic layer reduces data errors in gen-AI natural-language queries by as much as two-thirds compared with letting a model query raw, ungoverned tables directly.
Third-party analysts have taken notice of the broader pattern. According to Sean Zinsmeister and Karthik Ramakrishnan (Google Cloud, 2026), Google was named a Leader in the Gartner Magic Quadrant for Analytics and BI Platforms for the third consecutive year in 2026, with LookML’s code-based, Git-versioned semantic layer cited as a core reason.
Persistent Derived Tables (PDTs)
PDTs answer a narrower but practical question: what happens when the “one definition, reused everywhere” model gets expensive to compute? A PDT pre-computes a heavy join or aggregation once and stores the result, so every dashboard that needs it reads a cached table instead of re-running the same costly query. That is a real performance win, not just a governance one, and it is part of why LookML models scale to dashboards with hundreds of concurrent users.
Every benefit above traces back to the same root cause: one definition, reused everywhere, inside Looker. That is a genuine win for consistency and for AI agent accuracy, and it is also exactly the boundary the next section runs into.
What are the limitations of LookML, and when should you look beyond it?
LookML’s most-cited practitioner complaint is the learning curve. LookML adds a modeling layer, views, Explores, joins, dimensions, measures, on top of SQL instead of replacing it, so a new user is learning a second language rather than swapping one for another. Sigma’s Reed Rawlings, writing in 2023, summed up what he heard from new Looker customers: “Wow, LookML is pretty neat, but I’m worried about maintaining an entire code base just for analytics.” Sigma sells a competing BI tool, so read that as an interested party’s framing of a real maintenance cost.
The portability complaint that used to sit next to it has aged badly. Google documents two ways to read a LookML model from outside Looker. The Open SQL Interface exposes LookML models over JDBC to Tableau, ThoughtSpot, Power BI, Looker Studio and Excel, provided the project runs on a BigQuery connection. The Looker-managed MCP server, in Preview, lets Claude Desktop, Gemini CLI, Cursor, Copilot, Windsurf and Cline query LookML models directly, authenticating by OAuth and inheriting the user’s Looker roles and content access. Google’s own page for the semantic layer is headed “Ground your AI in truth with Looker’s open semantic layer.”
What LookML still does not answer is the cross-tool question. The Open SQL Interface exports LookML’s definition of a number; it does not adjudicate that definition against the one a dbt model, a spreadsheet, or another BI tool produces for the same metric. That is the gap common context problems across the data stack describes at a broader scale, and it is where an AI agent querying the warehouse directly still ends up with two numbers and no way to rank them.
None of this means LookML is poorly designed. It means LookML was built to solve definition drift inside Looker, not definition drift across the rest of the stack, which is a different problem with a different fix.
How Atlan approaches LookML
Atlan sits underneath LookML and every other semantic layer a team runs, cataloging what already exists instead of asking anyone to model a metric a second time. Atlan has a live Looker connector that catalogs Explores, dashboards, models, views, folders, and tiles, and it crawls the underlying LookML files to resolve lineage, confirming that a table referenced inside a LookML model is the same physical table Atlan already tracks from a Snowflake or BigQuery connection.
In practice, that means a LookML measure’s definition, and its lineage back to the raw columns it draws from, become visible in the context layer that sits across LookML, dbt, and every other tool with its own opinion about what a metric means. LookML is well-designed for what it does inside Looker. Atlan’s job is narrower: making that definition, and how it relates to what other tools call the same number, visible outside Looker too.
See Looker metadata in the context layer
Watch how Atlan catalogs Looker Explores, dashboards, and LookML models, then connects each one back to the warehouse tables and other tools that define the same metric.
Watch a Live DemoLookML solved definition drift inside Looker, not everywhere else
LookML did exactly what it was built to do: give one team, inside one BI tool, a single, version-controlled place to define what a metric means. Google has since pushed that model outward, over JDBC and over MCP, so a LookML measure is no longer stuck behind the Looker interface.
Portability was never the harder half of the problem. dbt’s Semantic Layer, Cube, and Lightdash each solve “define it once” inside their own walls, and none of them know what the others call the same number. A context graph underneath all of them, not another semantic layer competing for the same job, is what turns five disconnected definitions back into one traceable answer.
FAQs about LookML
1. Is LookML based on SQL?
LookML is not SQL itself, it is a modeling layer that sits on top of SQL. LookML defines dimensions, measures, and joins in a declarative syntax, and Looker’s SQL generator translates those definitions, plus a user’s Explore selections, into the SQL query that runs against the warehouse.
2. What is a LookML dashboard?
A LookML dashboard is a Looker dashboard built from LookML-defined Explores rather than assembled ad hoc. Because every tile pulls from the same underlying LookML model, the dimensions and measures stay consistent across tiles, and a change to a metric’s definition propagates to every dashboard that uses it.
3. What is the difference between Looker and LookML?
Looker is the business intelligence platform, the application analysts open to explore data and build dashboards. LookML is the modeling language inside Looker that defines what the data means: the dimensions, measures, and relationships that Looker’s Explore interface and SQL generator rely on.
4. Is LookML a programming language?
LookML is a domain-specific, declarative language, not a general-purpose programming language like Python or Java. It describes what a data model looks like, its fields, joins, and relationships, rather than a sequence of instructions, and it has no loops or functions of its own.
5. Can I use LookML with Looker Studio?
Yes, in one direction. Looker Studio, formerly Google Data Studio, is a separate, free reporting tool from Google. It cannot author LookML, but its Looker connector reads LookML-defined content: each Looker data source represents a single Explore, and one report can pull in Explores from more than one Looker model. Looker Studio is also one of the applications Google names as a consumer of the Open SQL Interface. Authoring LookML still happens inside Looker, the enterprise BI platform Google now owns.
6. How does LookML improve data governance?
LookML improves governance by centralizing metric definitions in version-controlled files instead of letting every dashboard redefine a calculation independently. Changes go through Git review like application code, so a team can see who changed a metric’s definition, when, and why before it reaches production reports.
7. Is LookML difficult to learn?
Yes, most practitioners describe a real learning curve, even for people who already know SQL well. LookML adds its own modeling concepts, views, Explores, joins, dimensions, and measures, on top of SQL rather than replacing it, so new users are learning a second layer, not swapping one language for another.
Sources
- Introduction to LookML, Google Cloud
- How Looker’s semantic layer enhances gen AI trustworthiness, Google Cloud Blog
- Looker in 2026: Gartner Analytics and BI Platforms MQ, Google Cloud Blog
- Open SQL Interface, Google Cloud
- Looker MCP server, Google Cloud
- Connect to Looker from Looker Studio, Google Cloud
- Looker’s open semantic layer, Google Cloud
- The Problem With LookML, Sigma Computing
- Revamped dbt Semantic Layer: Enhanced Metrics Definition and Querying With MetricFlow, dbt Labs
