Data Mart vs. Data Warehouse: Should You Use Either or Both?

Share this article
Let’s begin by understanding the difference between data mart vs. data warehouse:
Permalink to “Let’s begin by understanding the difference between data mart vs. data warehouse:”- A data mart is a location within a data warehouse that focuses on a specific business unit, department, or project. It represents a smaller, more focused fragment of a company’s data warehouse.
- Meanwhile, a data warehouse is a central data repository that holds large amounts of structured data from different areas of the organization. So, a data mart is a subset of a data warehouse.
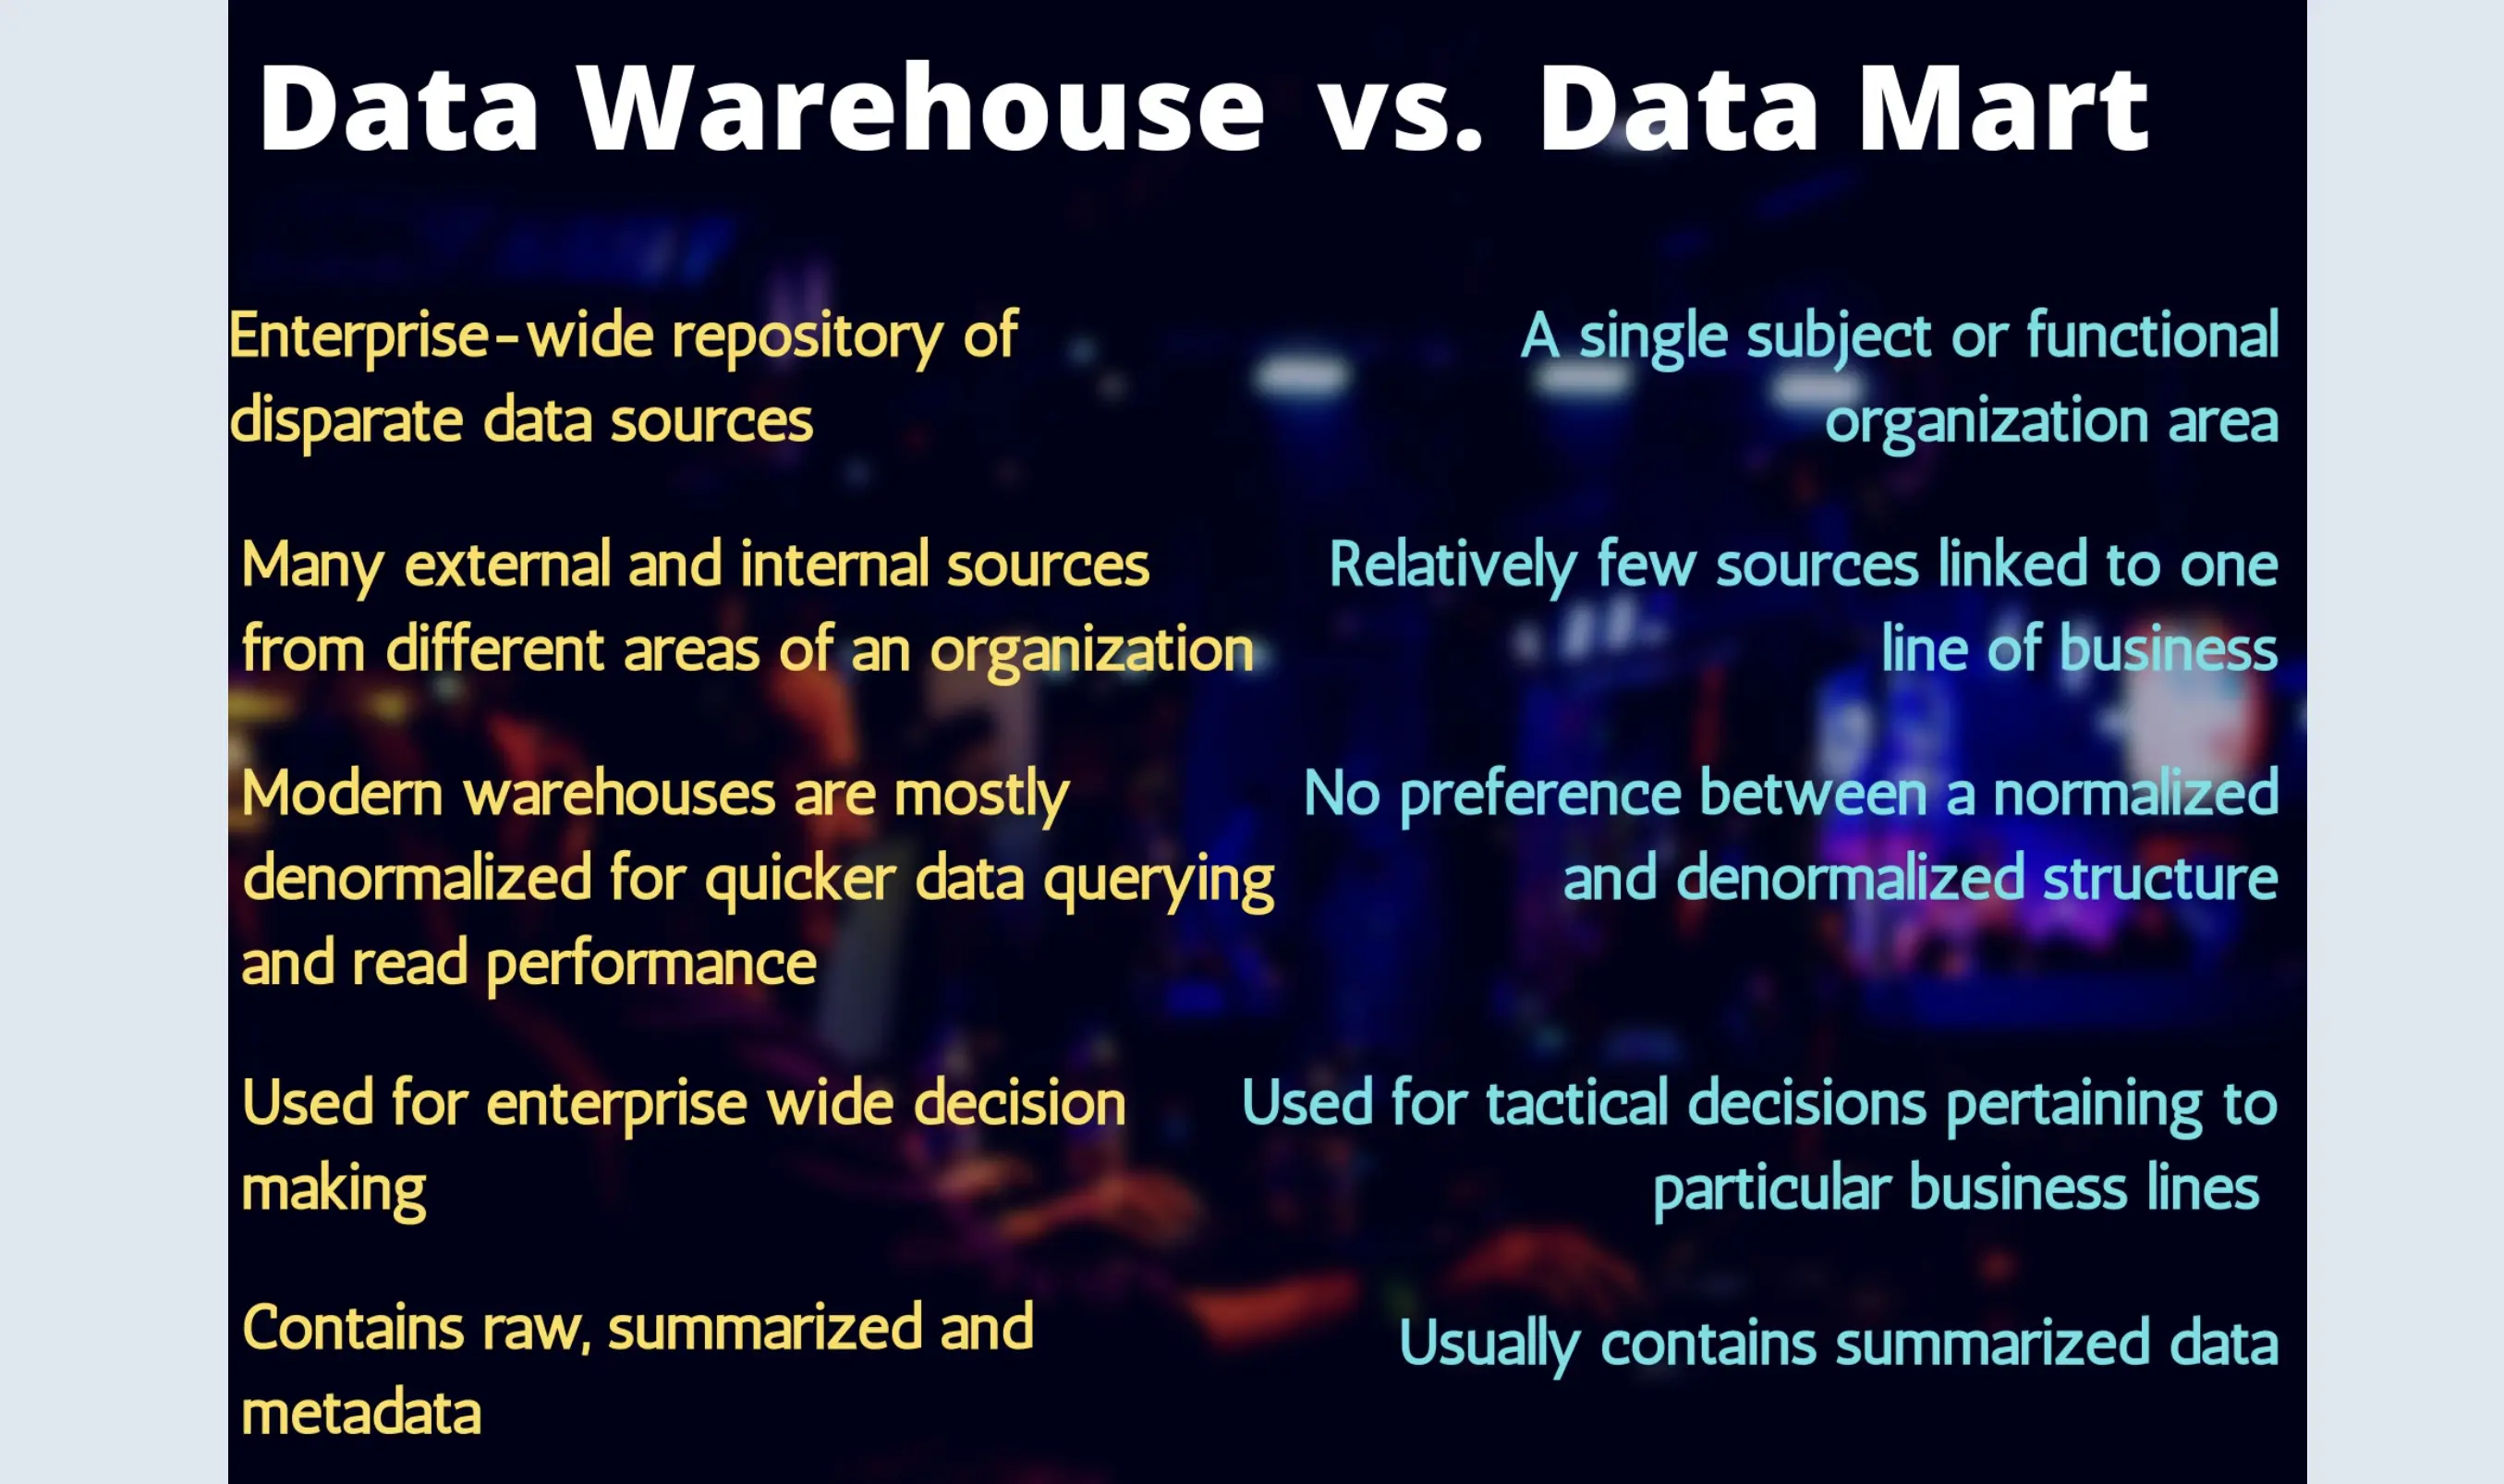
Data mart vs. data warehouse: The key differences. Source: Battle of data nerds: Ravi Dawar
Since a data mart is akin to a niche database within a warehouse, the data within data marts is structured, just like in a warehouse.
This article will explore the information flow within data warehouses and marts, followed by their use cases to understand the differences further.
The differences between data lake vs. data warehouse vs. data mart
Typical flow of data in an organization: Lakes to warehouses to marts
Permalink to “Typical flow of data in an organization: Lakes to warehouses to marts”Since every organization has hundreds of thousands of data sources, data engineers maintain all that data in its raw form in a data lake. However, the lake data is unusable in its original format as it’s unstructured and messy. For example, data lakes may contain files such as audio and video from various marketing campaigns — qualitative, unstructured data.
Engineers must transform such data into a structured format by:
- Implementing a modelling technique to manage the metadata
- Loading the transformed data into the warehouse (and marts) in a way that’s easy to search and access
Let’s explore each of the above steps further.
Modelling techniques for the data warehouse
Permalink to “Modelling techniques for the data warehouse”Modelling is crucial to extract value from warehouse data. Here’s how one engineer puts it:
“As a data engineer, you know SQL very well and can probably write SQL queries all day long. But you cannot assume that the typical end-user will be an expert on writing SQL queries. So, our objective is to build a data warehouse so easy for analysts to write analysis queries quickly and effectively.”
Modelling is also all about managing the metadata. The perfect design would help you answer questions such as:
- Where is the data you want?
- What is that data made of?
- Who owns it?
- How does it connect with or impact other data sets?
That’s why business use cases and rules should drive data modelling techniques. There are two prominent data modelling techniques for warehouses — dimensional data modelling (DDM) and Data Vault.
1. Dimensional data modelling
Permalink to “1. Dimensional data modelling”Dimensional data modelling (DDM) is a traditional technique for designing data warehouses. It is a data warehouse design methodology from Ralph Kimball and Margy Ross, co-authors of “The Data Warehouse Toolkit” — considered to be a classic guide to dimensional modelling.
The DDM is a bottom-up approach — the key business processes are identified and the relevant data is modelled first, before moving on to additional business processes. Each business process can be mapped into a unique data mart.
The building blocks of DDM are:
-
Facts: Facts are measurements — metrics or numeric values. Examples include sales amount or the number of products sold. Fact tables store transactional or event data.
-
Dimensions: Dimensions offer context — the “who, what, where, when, why, and how” — on the facts. For example, if the sales amount is the fact, the dimensions would include the time of sale, product description, store name and address, etc.
Dimension tables store this descriptive data. Kimball and Ross call dimension tables the “soul of the data warehouse”, as they contain the context required to run an in-depth analysis using the warehouse data.
You can design a dimensional model using schema — mapping out how the data will be organized within a database. Most cloud data warehouses use the star or snowflake schema. Let’s understand each schema further.
Star schema
In the star schema dimension tables surround a central fact table. The fact table can have multiple joins to connect itself with the surrounding dimension tables.
The fact table will contain the primary keys or metrics such as:
- Sales order number
- Order ID or Account ID
- Sales amount
- Product key
- Number of products sold
Meanwhile, the dimension tables contain attributes describing each dimension. Each dimension table can only link to the main fact table — a single join. For a fact table with the total sales amount, here are some dimension tables:
- Time dimension tables describing the day, month, year, and time of sales
- Geography dimension tables with location data such as country, state, city, or pin code
- Product dimension tables with product description and category
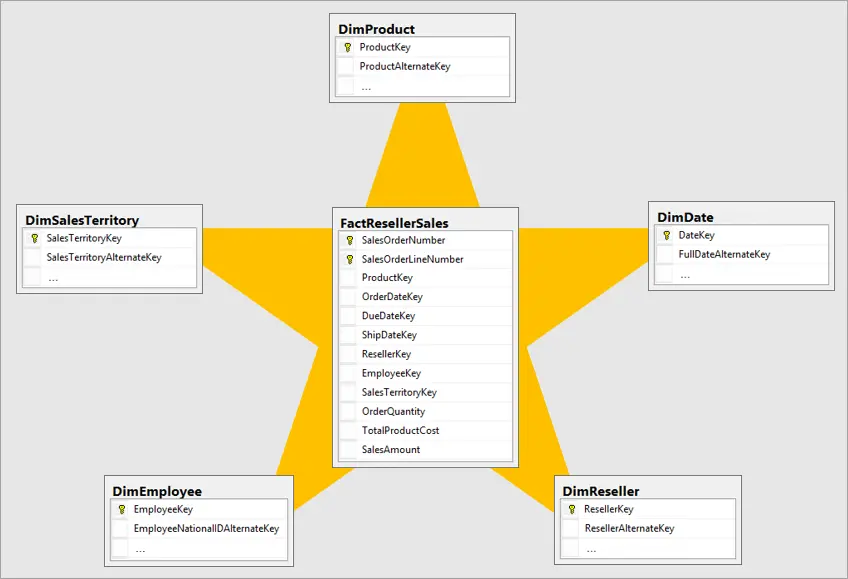
The star schema: The most commonly used data model for working with data warehouses and data marts. Source: Microsoft
Snowflake schema
The snowflake schema is an extension of the star schema. Each dimension table can be linked to one or more dimension tables — multiple joins or a many-to-one relationship.
Querying the snowflake schema is more complex because of the multiple joins and an increased number of tables. However, the schema reduces data redundancy and helps save storage space.
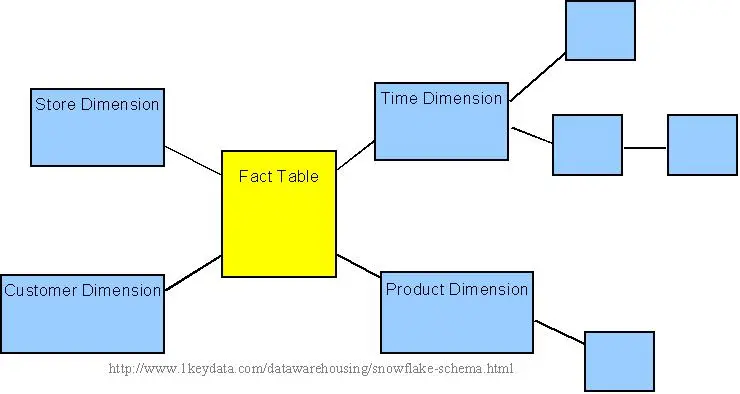
The snowflake schema: An extension of the star schema.
Data teams around the world use Atlan to bring their data to life
Join us Thursdays, 11 am EST
2. Data Vault 1.0 and 2.0
Permalink to “2. Data Vault 1.0 and 2.0”Data Vault is an alternative approach to architect warehouse data from Dan Linsteadt. Linsteadt defines the Data Vault as “a detail-oriented, historical tracking and uniquely linked set of normalized tables that support one or more functional areas of business”.
The Data Vault can contain:
- The Raw Vault: The first storage layer with unfiltered data
- The Business Vault: An extension to the Raw Vault with business rules applied to the data, making it easy to access and understand for business users
The original Data Vault (i.e., Data Vault 1.0) had three different types of tables:
-
Hubs: Hubs are a list of unique business keys (or natural keys). Think of these as the core business concepts. The hub has a business key — the primary identifier like a unique product identification number — and surrogate keys that connect it to other structures.
Hubs are the fundamental building blocks of the Data Vault design.
-
Links: Links map the unique relationships between various Hubs (i.e., business keys). They can be seen as many-to-many join tables with no real data. An example of a Link table is a list of all sales and the customers associated with each sales order.
-
Satellites: Satellites hold all the descriptive attributes — historical and real-time. They form the “meat” of the Data Vault model as they store information about Hubs and their relationships.
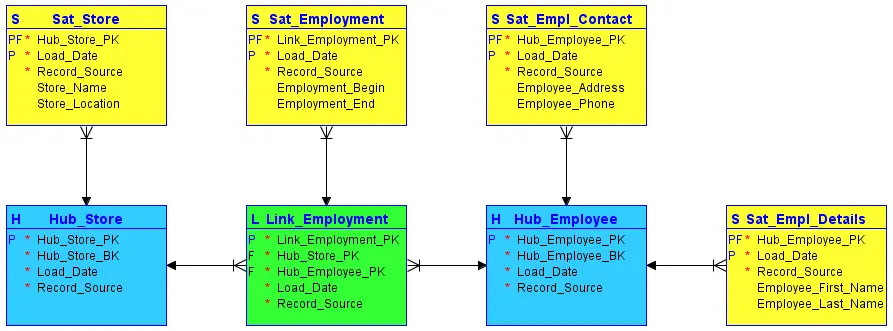
Data vault model for building enterprise data warehouses. Source: TDAN
Data Vault 2.0 adds two more table types:
- PIT (Point-in-Time): A Point-In-Time table is used to extend the Satellite tables. It can identify the relevant records from each Satellite for a specific date or timestamp.
- Bridge: A Bridge table is used to extend the Links tables. It can connect several Hubs and associated Links. It doesn’t contain any information from Satellite tables.
A major advantage of a Data Vault is that it stores raw copies of data, separated entirely from business rules. So, if business rules were to change, the data would be easier to manage and system complexity would be greatly reduced.
In a Data Vault, the data marts are views that sit atop raw data and data with business logic applied to it. Because there are no tables, marts are easier to change over time.
However, it comes with a steep learning curve and increases in complexity when it comes to large enterprise data ecosystems.
Dimensional Data Modelling (DDM) vs. Data Vault: What’s the difference?
Permalink to “Dimensional Data Modelling (DDM) vs. Data Vault: What’s the difference?”Choosing a warehouse modelling technique depends on the use case. For instance, the Data Vault approach is a great option for situations where the data warehouse and marts will be significantly changing over time as you can add new data sources and define business rules on the fly.
Meanwhile, less complex ecosystems where the business rules won’t change as much can work with the dimensional modelling (DDM) approach.
Here’s a great analogy to summarize these differences:
“Although Dimensional Data Modelling and the Data Vault methodology are two sides of the same coin, they are fundamentally different. Their respective differences are very analogous to how most doctors differ from psychiatrists – most doctors deal with the body and psychiatrists deal with the brain and behavior.”
[Download ebook] → Building a Business Case for DataOps
Download ebook
Loading the transformed data into the warehouse and marts
Permalink to “Loading the transformed data into the warehouse and marts”Having understood warehouse design approaches, let’s see how they work.
After deciding upon a schema, engineers can maintain the structured data into a staging layer to start transforming it and then load it into an enterprise data warehouse.
The staging layer helps ensure data consistency as engineers can apply several transformations such as data type casting, column name changes, and timezone conversions. For instance, some timestamp columns may be in UTC, whereas others in PST. The staging layer is perfect for fixing such inconsistencies from the get-go.
After transforming raw data, you can load them into data marts specific to your business verticals, such as finance, marketing etc. on top of the warehouse. For example, you can build a data mart specifically for your marketing team containing key metrics and context such as media spend per media type, overall engagement, customer acquisition cost, etc.
In the case of a bottom-up approach like Kimball’s DDM, you build the warehouse gradually by adding new data marts (i.e., a combination of facts and dimensions).

Ralph Kimball’s view of botton-up data warehouse design. Source: AWS Whitepaper
Meanwhile, the Data Vault approach lets you load data and set business rules simultaneously. Here’s how that would look when using Amazon Redshift.
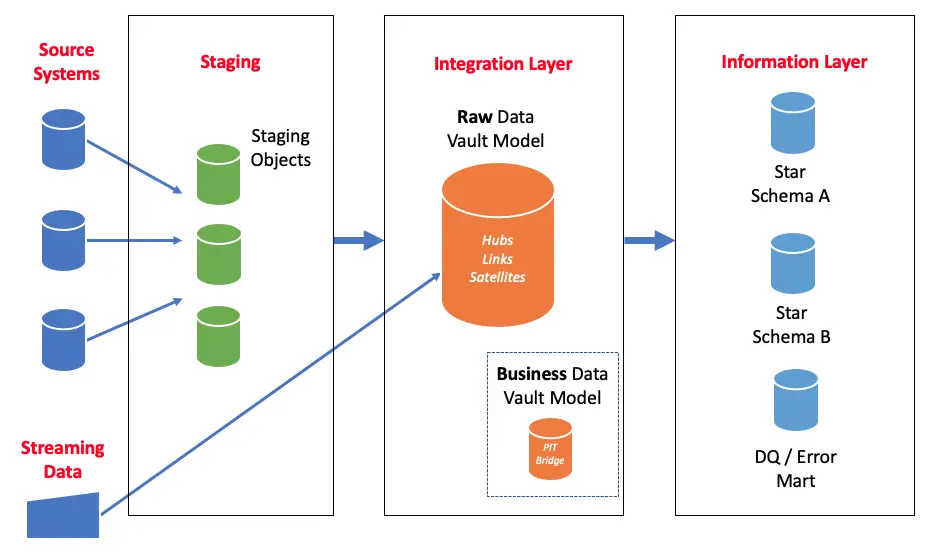
Data vault apporach in Amazon Redshift.
Data warehouse and data marts: How are they used?
Permalink to “Data warehouse and data marts: How are they used?”So far, we’ve looked at the difference between a data warehouse and a data mart, the design approaches for warehouses, and the process of loading and transforming data in warehouses and marts.
Now let’s consider two use cases — Rittman Analytics and McDonald’s — to see these concepts in action.
Rittman Analytics
Permalink to “Rittman Analytics”Rittman Analytics adopted the Kimball approach to data warehousing. They use Google BigQuery as their cloud data warehouse and dbt for transforming data from various sources.
Raw data from various sources gets added to an integration layer, where it’s compiled and orchestrated using dbt.
The transformed data in the centralized repository is then loaded into use-case-specific data marts, such as:
- Finance: Transactions and Invoices are the fact tables, whereas Currencies and Charts of Accounts are the dimension tables
- CRM: Deals is the fact table, whereas Companies and Contacts are the dimension tables
- Projects: Timesheets and Delivery are the fact tables, whereas Projects, Users, and Tasks are the dimension tables
- Marketing: Email Sends, Email Send Outcomes and Campaign Performance are the fact tables, whereas Ad campaigns, Ad Sets, Email Campaigns, and Email Lists are the dimension tables
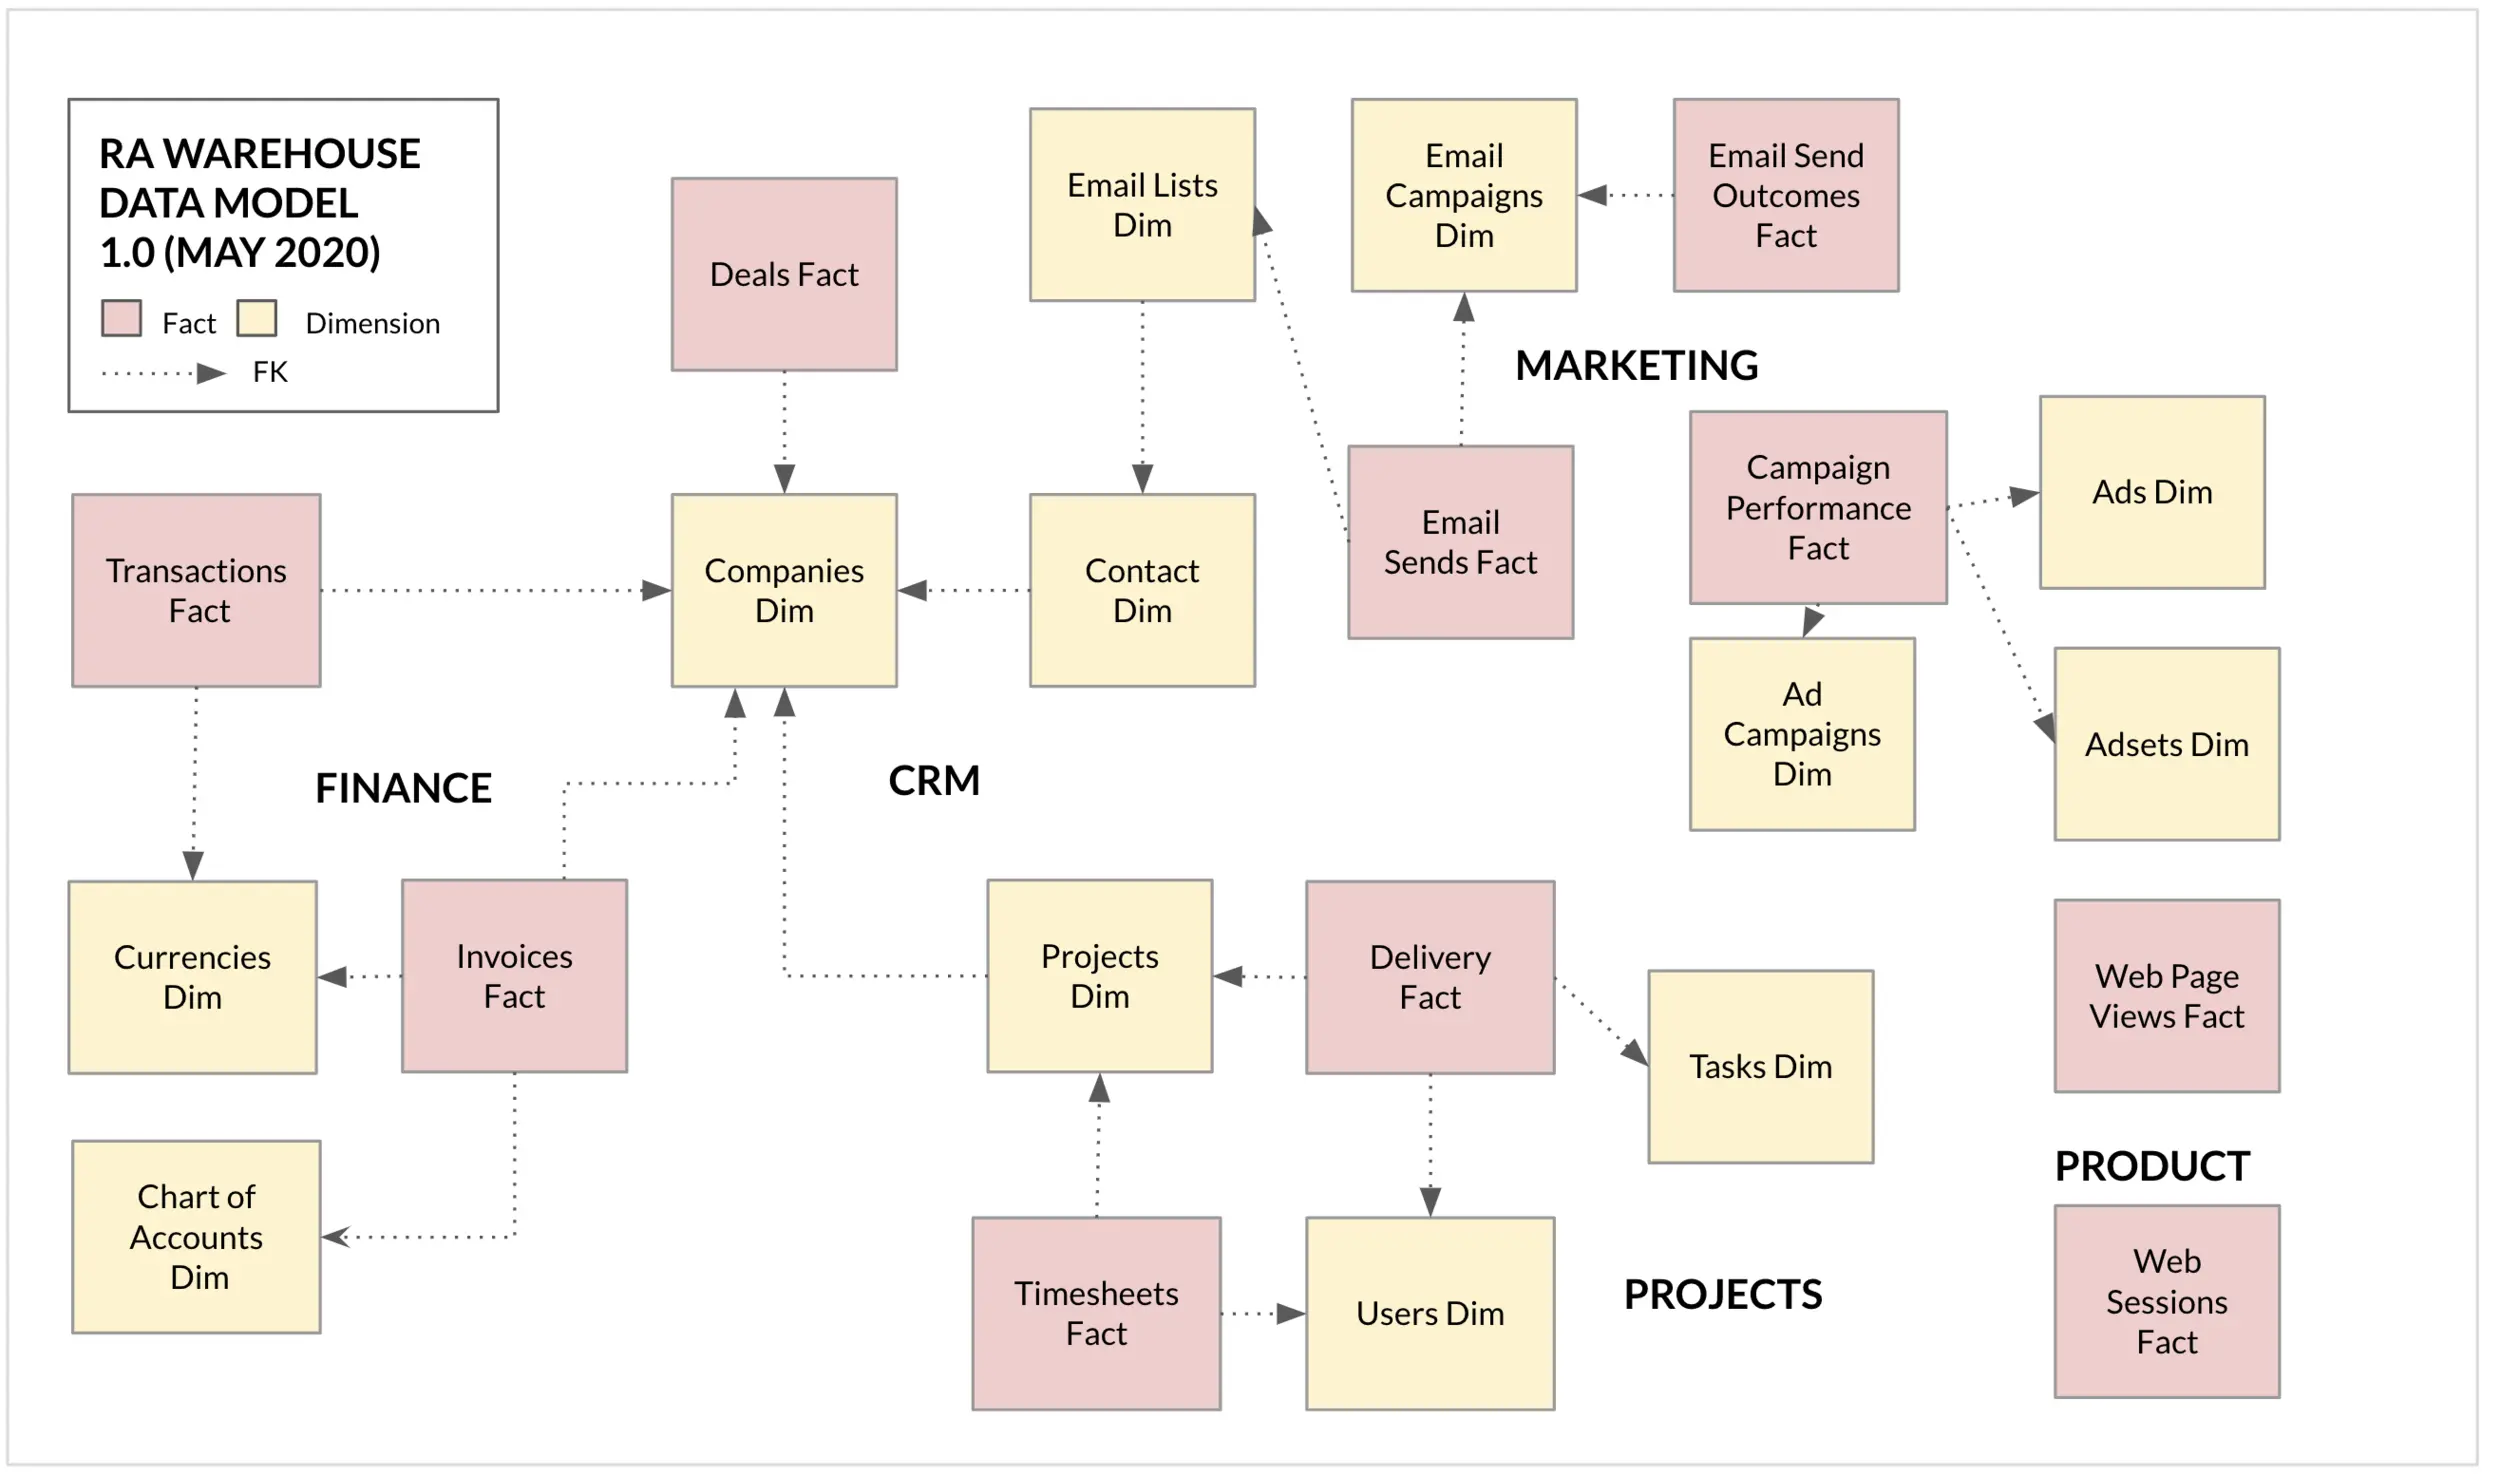
The data warehouse model — as adopted by Rittman Analytics. Source: Rittman Analytics
2. McDonald’s
Permalink to “2. McDonald’s”McDonald’s used Amazon Redshift to consolidate its annual transactions across all retail locations. The data collected would be refreshed every night. However, querying such a vast data repository was time-consuming and impractical.
So, McDonald’s set up data marts for each of its user personas, such as business analysts and data scientists. The company also built marts for various levels of querying. For instance, they built a data mart specifically for data exploration, so that the data scientists can search for patterns at granular levels.
Data warehouse vs. data marts: A quick recap
Permalink to “Data warehouse vs. data marts: A quick recap”As mentioned earlier, a data warehouse is a central repository for data from various data sources and a data mart is a small subset of the data warehouse, focused on a specific business need.
Within organizations, raw data from a data lake gets merged, transformed, and organized for the structured schema of data warehouses. Modern data warehouses are built using the Dimensional Data Modelling (DDM) or Data Vault approach. The schema used is either star, snowflake, or a combination of both, depending on each use case.
The warehouse data is further organized into data marts to simplify data access, context, and use for business users. To further your understanding of cloud data warehousing platforms, check out our comprehensive list of the best cloud data warehouse solutions.
Data marts and data warehouses: Resources to dig deeper
Permalink to “Data marts and data warehouses: Resources to dig deeper”- Learn more about modern data architecture, why it is required, and the potential challenges you will face when implementing it.
- Explore how to properly build and integrate a data mart within your data warehouse.
- Read more about how Oracle defines a data warehouse and its key characteristics. For another definition of a data warehouse, check out this article.
- To help decide whether a data lake, data warehouse, or data mart is right for your needs, check out this post.
Data marts vs. data warehouses: Related reads
Permalink to “Data marts vs. data warehouses: Related reads”- Data warehouse 101
- Cloud data warehouses: Cornerstone of the modern data stack
- Warehouse vs. Data Lake vs. Data Lakehouse | Differences
- Best cloud data warehouse solutions: A comparison and evaluation guide
- What is a data lake: Definition, examples, architecture, and solutions.
- What is a data lakehouse: Definition, architecture, components, and use cases.
Share this article


