

A data graph is a structure of nodes and edges representing how enterprise data connects, the primitive behind graph databases like Neo4j and TigerGraph and behind Atlan’s governed layer on top of it. The phrase covers at least four distinct meanings, from a statistics-class chart to Salesforce’s branded “Data Graphs” feature in Data Cloud. Add semantics and it becomes a knowledge graph; add governance and agent-ready delivery, as in Atlan’s Enterprise Data Graph, and it becomes a system AI agents can query safely.
Enterprise teams often collide with the other three meanings first:
- Four competing meanings: a statistics chart, Salesforce’s Data Cloud feature, a pipeline DAG, and the entity-relationship structure this page defines.
- Two required parts: nodes (entities) and edges (relationships).
- One upgrade path: add semantics and a data graph becomes a knowledge graph.
- One governed endpoint: reverse-built from metadata already in an estate, not modeled from a blank ontology.
| What it is | Nodes (entities) and edges (relationships) representing how data connects |
| Not to be confused with | A statistics chart; Salesforce’s “Data Graphs” feature; a pipeline DAG (Airflow, dbt) |
| Core components | Nodes, edges, direction (optional), weight (optional) |
| Related concept | A knowledge graph is a data graph plus semantics and an ontology |
| Atlan’s implementation | Enterprise Data Graph, reverse-constructed from metadata, governed, queryable via MCP |
| Common use cases | Fraud detection, recommendations, lineage, org mapping |
What is a data graph?
A data graph is a structure of nodes and edges, but the exact phrase carries at least three other meanings unrelated to enterprise data infrastructure. Ruling those out first is the fastest way to the correct answer.
The statistics-class meaning
In introductory statistics and grade-school contexts, “data graph” often just means a bar, line, or pie chart used to visualize numbers, a different domain that ranks here only because the phrase is used literally.
Salesforce’s Data Graphs product feature
Salesforce’s Data Cloud ships a feature literally named “Data Graphs” that combines Data Model Objects into queryable views, per Salesforce’s own documentation: a Tier-1 vendor owning this exact phrase for a specific capability.
The DAG, or pipeline-orchestration, meaning
In data engineering, “data graph” is sometimes used loosely for the directed acyclic graph, or DAG, that tools like Airflow or dbt build to model pipeline dependencies: job order, not entity meaning.
The data-infrastructure meaning
Ruling out the three meanings above leaves the one this page covers: a non-linear structure of nodes (vertices) and edges, the standard graph-theory shape underlying graph databases generally, used to represent how enterprise data connects. Nodes are things: people, assets, transactions, concepts. Edges are the relationships between them: owns, references, derived-from, reports-to.
This structural view underlies enterprise data infrastructure, from a plain knowledge graph to Atlan’s own governed implementation. Vendors disagree on storage engines (Neo4j vs TigerGraph vs the rest), but nodes-and-edges is the shared shape underneath. The definition is not the interesting part; what governs the structure once built is, where a data graph stops being a diagram and starts being a component inside something larger.
How does a data graph work?
A data graph keeps two kinds of things, nodes and the edges connecting them, so a system traverses relationships instead of joining flat tables. Nodes represent entities: a customer, a table, a dashboard, a person. Edges represent the relationship between two nodes, owns, queries, derived-from, reports-to, directed (“depends on”) or undirected (“is related to”). A context graph applies this same shape at the AI-agent layer, where nodes are business concepts and edges are the relationships an agent needs to reason correctly. Atlan’s own Enterprise Data Graph applies the identical model to metadata: tables, dashboards, and pipelines become nodes, lineage one of several edge types connecting them.
Observe Inc.'s own “Data Graph” feature illustrates this at production scale, turning telemetry into linked “things” like pods and shopping carts for root-cause investigation.
Graph adoption has real friction. “Graph systems are notoriously difficult to scale, which is one of the main reasons they have not been widely adopted by enterprises with very large datasets,” says Weimo Liu, Co-founder, PuppyGraph, background in TigerGraph and Google’s F1 team.
The hard part was never the node-and-edge concept. It is keeping the structure current and safe for an AI agent to query at runtime, which a raw context graph tooling stack does not provide alone.
The CIO's Guide to Context Graphs
A practical framework for evaluating where context graphs fit in your AI architecture, and the questions to ask before your team builds one from scratch.
Get the CIO Context GuideWhat is the difference between a data graph and a knowledge graph?
Add semantics to a data graph and you get a knowledge graph: an ontology defining what each node and edge type means.
| Aspect | Data Graph | Knowledge Graph | Graph Database |
|---|---|---|---|
| What it is | Nodes and edges representing connections | A data graph plus semantics, an ontology defining meaning | The engine graphs run on (e.g., Neo4j, TigerGraph) |
| Primary question | What connects to what? | What does this connection mean? | How do I store and query it? |
| Semantic richness | Low; structure only | High; types, meaning, inference | Depends on schema |
| Example | Assets and lineage edges in a catalog | Ontology-backed glossary plus relationships | Neo4j, TigerGraph, or Memgraph |
“Knowledge graphs are semantically rich, which makes them more verbose,” per Liana Kiff, Senior Consultant, Tom Sawyer Software. PuppyGraph’s comparison agrees: it is a modeling choice layered on graph storage, not a replacement for it. Atlan’s Enterprise Data Graph follows this pattern, layering ontology and certification onto the data graph already implicit in existing metadata.
The data graph is the substrate; the knowledge graph adds meaning, the same superset argument context layer vs knowledge graph and context layer vs semantic layer make in full. A vector database indexes embeddings for similarity search instead, a distinction context graph vs vector database, vector store vs graph database for agent memory, and vector database vs knowledge graph for agent memory each explore.
Context Maturity Assessment
A short, practical assessment to see how ready your current metadata and lineage are to support a governed data graph, before you invest engineering time in building one.
Assess Context Maturity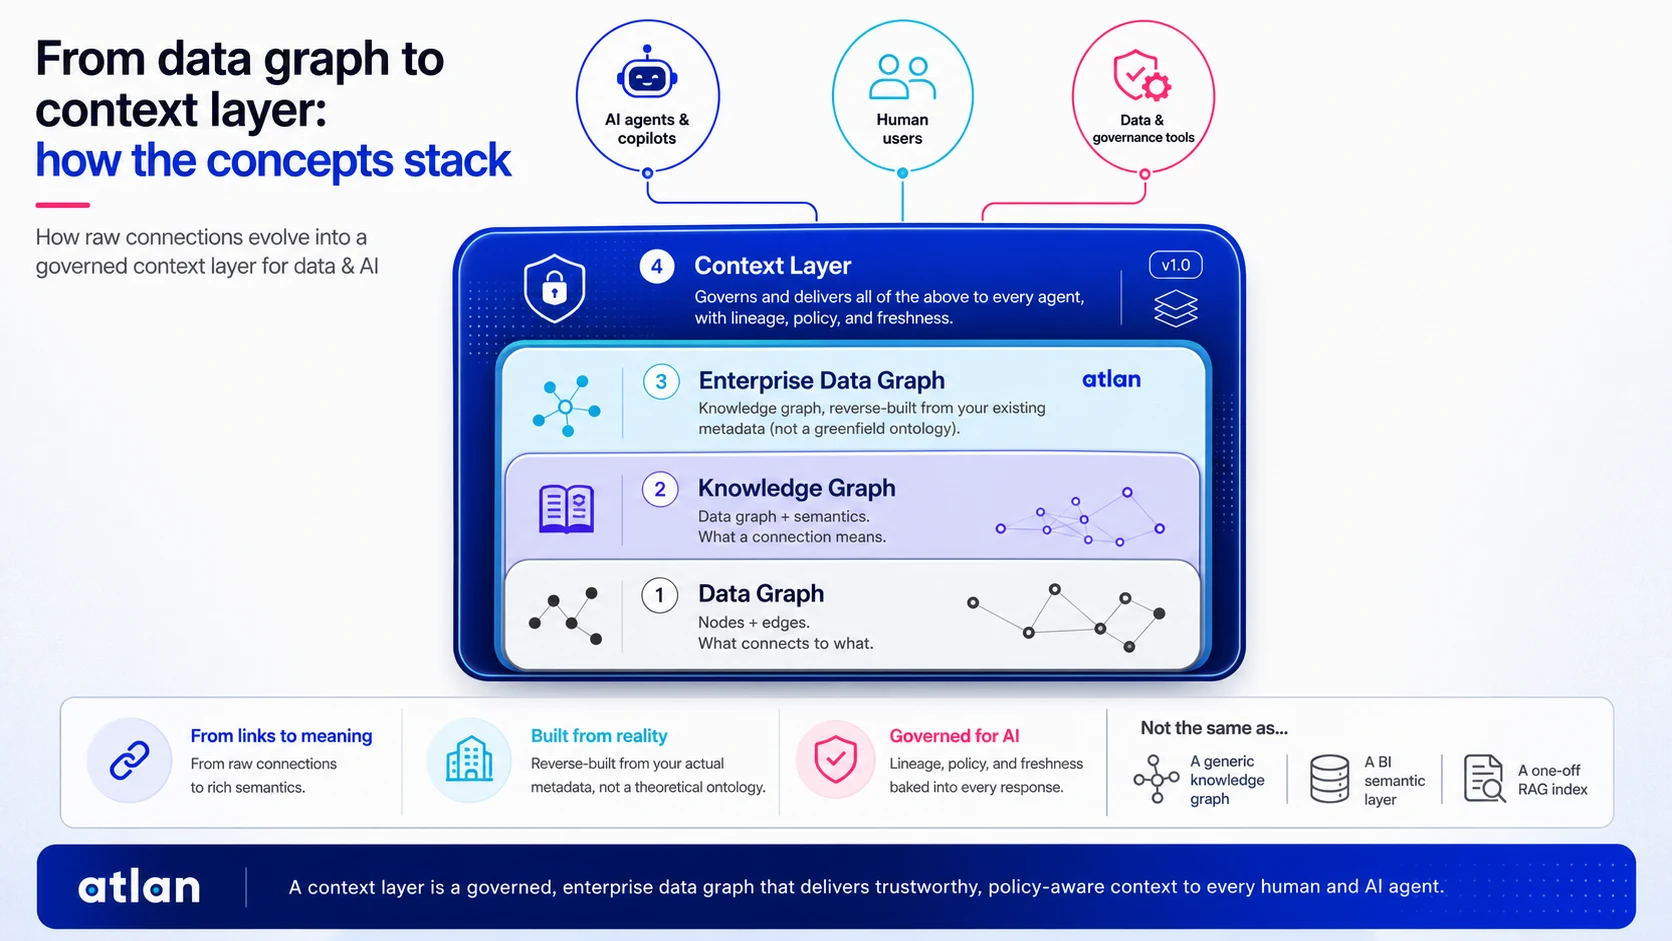
What are common data graph use cases?
Data graphs show up anywhere connections matter more than individual records. Fraud rings, product recommendations, and enterprise lineage all reduce to the same node-and-edge pattern.
| Use Case | What Connects | Enterprise Example |
|---|---|---|
| Fraud detection | Accounts, transactions, devices | Flagging rings of accounts sharing devices or payment methods |
| Recommendations | Users, products, purchase history | “Customers who bought X also bought Y” traversal |
| Network and root-cause analysis | Services, dependencies, incidents | Tracing an outage to its upstream cause across a service graph |
| Data lineage and asset relationships | Tables, dashboards, pipelines, owners | Tracing which dashboards break if a source table changes |
Neo4j’s own use-case research lists fraud detection, recommendations, and network analysis among the most common production graph applications. A team building a knowledge graph for AI agents is usually solving the lineage or org-mapping case from that table, just with an agent as the consumer instead of a human analyst querying context graph tools built for AI agents, eventually needing to query that context graph with an AI agent directly rather than through a dashboard. Atlan’s own Enterprise Data Graph is scoped to that last row: lineage and asset relationships, extended so an agent can query them through MCP rather than a lineage diagram built for humans.
The use case rarely dictates the architecture. What separates a durable graph from an abandoned one is whether it stays wired to the systems generating the underlying data, which is a governance question more than a graph-theory one.
Should you build a data graph yourself, or use a governed one?
Building a data graph takes nothing more than a graph database and a modeling exercise, but the common mistake is starting from an abstract ontology instead of a real business question.
Teams that begin with “what should our ontology look like” tend to produce a graph that is internally elegant and disconnected from how the business operates. A true greenfield environment with no existing lineage or catalog metadata has little else to start from, but most enterprises already have years of query history, glossary terms, and lineage sitting in a catalog, and starting from a blank ontology throws that away. Atlan’s own approach mirrors the opposite order: the Enterprise Data Graph is reverse-constructed from metadata already being ingested, SQL query history, BI semantics, lineage, policy tags, rather than modeled as a greenfield project. A graph modeled from an abstract schema needs a second project just to connect it back to production; a graph reverse-built from metadata already flowing through an estate starts connected.
This page only bridges the point; the complete build-versus-buy tradeoffs, tooling choices, and ongoing maintenance cost are covered in DIY context layer: what it takes to build one yourself. For readers evaluating how to build a context graph for enterprise AI or comparing that path against an agent context graph, the same lesson from static metadata failing agents applies: a data graph not kept current is the same as no data graph at all.
How Atlan approaches the data graph
Atlan treats the data graph as a structural substrate, not an end concept: the Enterprise Data Graph is its governed, agent-facing implementation, reverse-constructed from metadata already ingested across 80+ connectors, SQL history, BI semantics, lineage, policy tags, adding temporal validity, ownership, and certification so the graph stays current, not just browsable. The Context Layer delivers it to every agent that needs it.
Most teams that set out to “build a data graph” start from a greenfield ontology exercise disconnected from the metadata they already have. Gartner predicts that, through 2026, organizations will abandon up to 60% of AI projects lacking AI-ready data infrastructure. The Context Lakehouse combines Atlan’s knowledge graph with Iceberg-native storage and vector-native search in one system, so teams are not stuck choosing graph versus vector, and an MCP server exposes the graph-backed context to AI agents at runtime.
In practice, sellers often introduce “data graph” as the approachable entry point, framing assets as nodes and lineage as one relationship type, before the conversation graduates to the full enterprise context layer. The Enterprise Data Graph page carries the customer detail behind that sequencing, the same relationship combining knowledge graphs with LLMs and data catalog vs context layer make from different angles.
Context Layer ROI Calculator
Estimate the engineering time a governed data graph saves versus building and maintaining one from scratch, based on your connector count and team size.
Calculate Context Layer ROIReal stories from real customers: turning raw structure into governed context
"We're excited to build the future of AI governance with Atlan. All of the work that we did to get to a shared language at Workday can be leveraged by AI via Atlan's MCP server…as part of Atlan's AI Labs, we're co-building the semantic layer that AI needs with new constructs, like context products."
— Joe DosSantos, VP of Enterprise Data & Analytics, Workday

"Atlan is much more than a catalog of catalogs. It's more of a context operating system…Atlan enabled us to easily activate metadata for everything from discovery in the marketplace to AI governance to data quality to an MCP server delivering context to AI models."
— Sridher Arumugham, Chief Data & Analytics Officer, DigiKey

Why the definition of a data graph is worth getting right
A data graph is the structural primitive: nodes and edges representing how data connects. Knowledge graphs, graph databases, and Atlan’s Enterprise Data Graph build on top of it, each adding a different layer: semantics, storage and query, or governed delivery.
Getting the definition right matters because the phrase is genuinely overloaded. A statistics chart, a Salesforce feature, and a pipeline DAG compete for the same three words.
Once the structure is clear, the more useful question is what governs it in production: whether the graph is reverse-built from metadata a team already trusts, kept current, and safely queryable by an AI agent rather than only browsable by a human. That is the layer Atlan’s Enterprise Data Graph and Context Layer provide, the same layer the sibling pages in this series work through from other angles: enterprise memory and enterprise skills, agentic AI memory vs a vector database, the types of AI agent memory an agent draws on, and how knowledge graphs compare to RAG as a retrieval strategy. A context graph compared against an ontology makes the identical point from the modeling side, and Gartner’s own coverage of context graphs treats this layering as the direction the category is heading, not an Atlan-specific claim.
FAQs about data graphs
1. What are data graphs?
A data graph is a non-linear structure of nodes (entities) and edges (relationships between them) used to represent how data connects. It underlies graph databases and knowledge graphs, with nodes representing assets, people, or transactions, and edges capturing ownership, lineage, or dependency.
2. What is an example of a data graph?
A fraud-detection graph is a common example: accounts, devices, and transactions are nodes; shared devices or payment methods are edges, letting investigators trace rings of connected accounts a flat table would hide.
3. What is the difference between a data graph and a knowledge graph?
A knowledge graph is a data graph with semantics added, an ontology defining what each node and edge type means. A data graph answers “what connects to what”; a knowledge graph answers “what does this connection mean.”
4. What is the difference between a data graph and a graph database?
A data graph is the logical structure: nodes and edges representing connections. A graph database, such as Neo4j, TigerGraph, or Memgraph, is the storage and query engine it runs on, an implementation choice, not the concept itself.
5. Is a data graph the same as a DAG in data pipelines?
No. A directed acyclic graph, or DAG, as used in tools like Airflow or dbt, models pipeline task dependencies: which job runs before which. A data graph models entity relationships in the data itself, like which table a dashboard depends on.
6. Is Salesforce’s “Data Graphs” feature the same as a data graph in general?
Not exactly. Salesforce’s Data Graphs combines structured Data Model Objects into queryable views, a branded product capability. The general concept, nodes and edges representing connected data, is broader and vendor-neutral; Salesforce’s feature is one implementation of it.
Sources
- Salesforce Help, “Data Graphs.” https://help.salesforce.com/s/articleView?language=en_US&id=data.c360_a_data_graphs.htm&type=5
- Observe Inc., “What Is the Data Graph?” https://www.observeinc.com/blog/what-is-the-data-graph
- Data Engineer Things Newsletter, “Community Spotlight” (Weimo Liu, PuppyGraph), March 2026. https://dataengineerthings.substack.com/p/data-engineer-things-newsletter-community-324
- Tom Sawyer Software, “Knowledge Graph vs Graph Databases” (Liana Kiff). https://blog.tomsawyer.com/knowledge-graph-vs-graph-databases
- PuppyGraph, “Knowledge Graph vs Graph Database: Key Differences.” https://www.puppygraph.com/blog/knowledge-graph-vs-graph-database
- Neo4j, “Top 10 Graph Database Use Cases.” https://neo4j.com/blog/graph-database/graph-database-use-cases/
- Gartner, “Lack of AI-Ready Data Puts AI Projects at Risk,” February 2025. https://www.gartner.com/en/newsroom/press-releases/2025-02-26-lack-of-ai-ready-data-puts-ai-projects-at-risk
- Wikipedia, “Graph database.” https://en.wikipedia.org/wiki/Graph_database
- Wikipedia, “Directed acyclic graph.” https://en.wikipedia.org/wiki/Directed_acyclic_graph
