Dagster is an open-source, cloud-native data orchestration engine to build, deploy, and manage data pipelines. It is inspired heavily by Airflow and started as an open-source library for building ETL/ELT processes and ML pipelines.
In this guide, we’ll explore Dagster’s architecture and core capabilities—equipping you with insights into this data orchestration tool.
Is Open Source really free? Estimate the cost of deploying an open-source data catalog 👉 Download Free Calculator
What is Dagster?
Permalink to “What is Dagster?”Dagster is an open-source data orchestrator to develop, manage, and observe data pipelines. It can help you with monitoring jobs, debugging runs, inspecting data assets, and launching backfills.
You can look at Dagster as a framework for building data pipelines. In your data ecosystem, Dagster aims to be the abstraction layer.
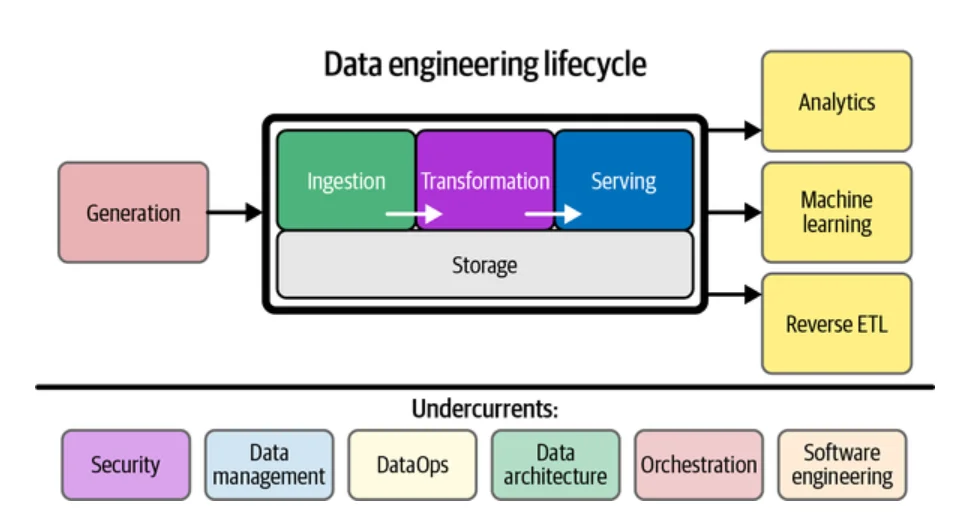
The data engineering lifecycle and how an orchestration tool like Dagster would fit into the picture - Source: O’Reilly.
Here’s how Nick Schrock, the creator of Dagster and GraphQL, puts it:
”Dagster is a new type of workflow engine: a data orchestrator.Moving beyond just managing the ordering and physical execution of data computations, Dagster introduces a new primitive: a data-aware, typed, self-describing, logical orchestration graph.”
Dagster is relatively new to the market when compared to tools like Airflow. Companies using Dagster include VMWare, Good Eggs, Drizly, Mapbox, Doordash, Prezi, and LINE (Thailand).
Before we explore Dagster’s architecture, let’s understand one of its fundamental concepts, i.e., software-defined assets (SDAs).
Abstraction in Dagster: An introduction to SDAs, ops, and graphs
Permalink to “Abstraction in Dagster: An introduction to SDAs, ops, and graphs”The basic elements of Dagster are software-defined assets (SDAs), ops, and graphs.
TL;DR
SDAs are code descriptions of assets and their computation, while ops are Python functions that compute asset contents. Interconnected ops form graphs, which handle complex tasks.
SDAs
Permalink to “SDAs”Most data pipelines can be expressed in Dagster as sets of software-defined assets (SDAs). An asset is an object, such as a table, file, machine learning model, or report.
A software-defined asset (SDA) is a description (in code) of what data assets should exist and how those assets should be computed.
An SDA has three parts:
- A global identifier for each asset called the asset key
- A function producing the asset called an op (i.e., a sub-graph)
- A set of upstream asset keys, referring to the inputs to the op (i.e., asset definitions)
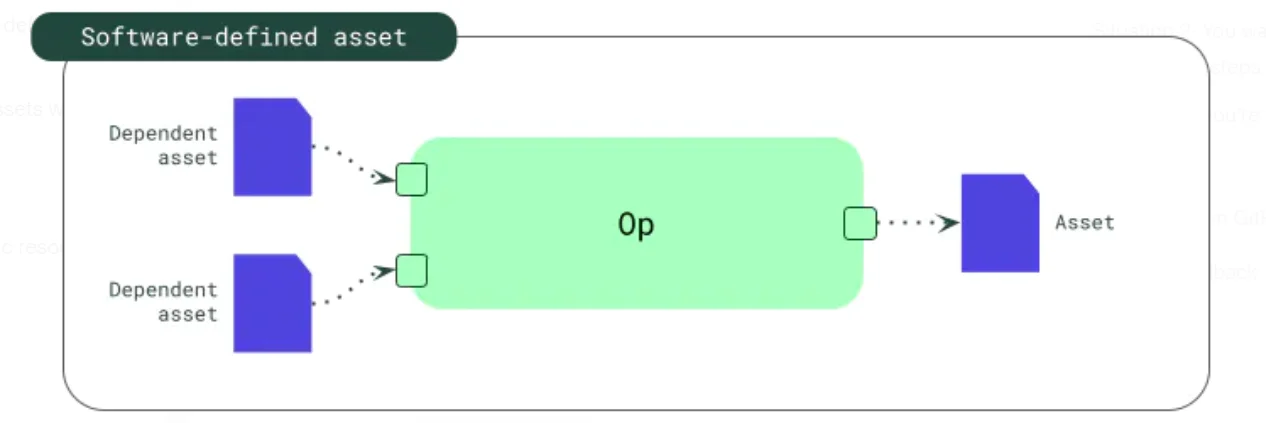
A software-defined asset in Dagster - Source: Dagster Docs.
Software-defined assets make a declarative approach to data orchestration possible since they define each asset’s origins and contents.
“Instead of describing the chaos that exists, SDA declares the order you want to create. Once you’ve declared this order you want to create, an asset-based orchestrator helps you materialize and maintain it.” Sandy Ryza, Lead Engineer at Dagster
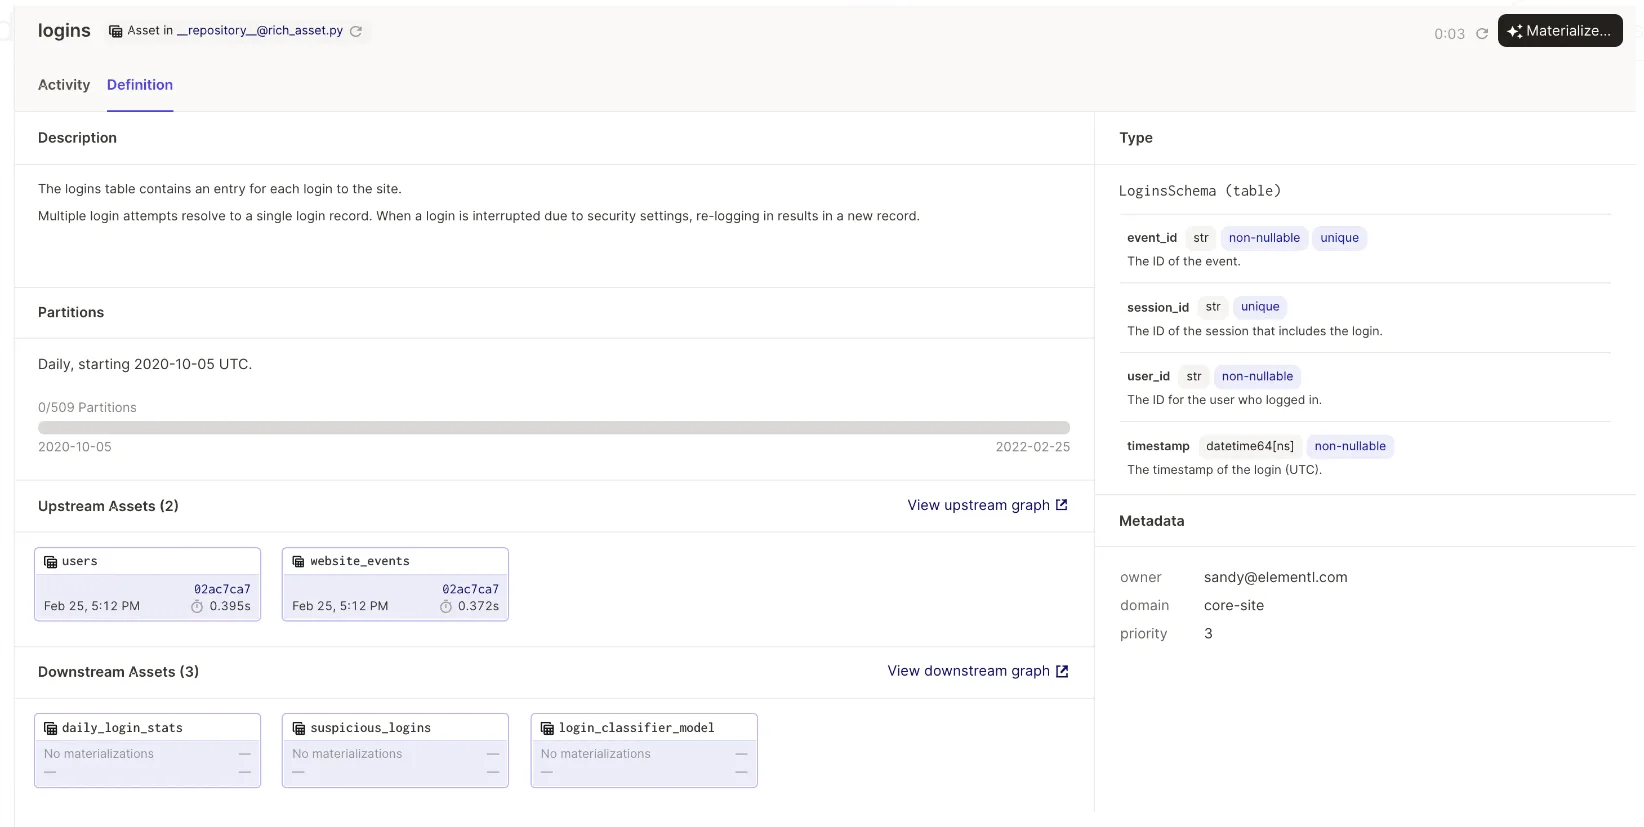
The Definition tab gives context about an asset - Source: Dagster Blog.
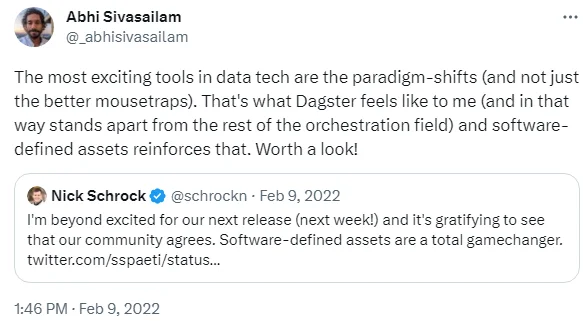
SDAs reinforce Dagster’s approach to data orchestration - Source: Twitter.
Ops
Permalink to “Ops”An op is a Python function responsible for computing the contents of the asset from its upstream dependencies. An individual op performs simple tasks, such as:
- Sending an email or a Slack message
- Starting a Spark job
- Querying an API
Ops are used within a job or a graph.
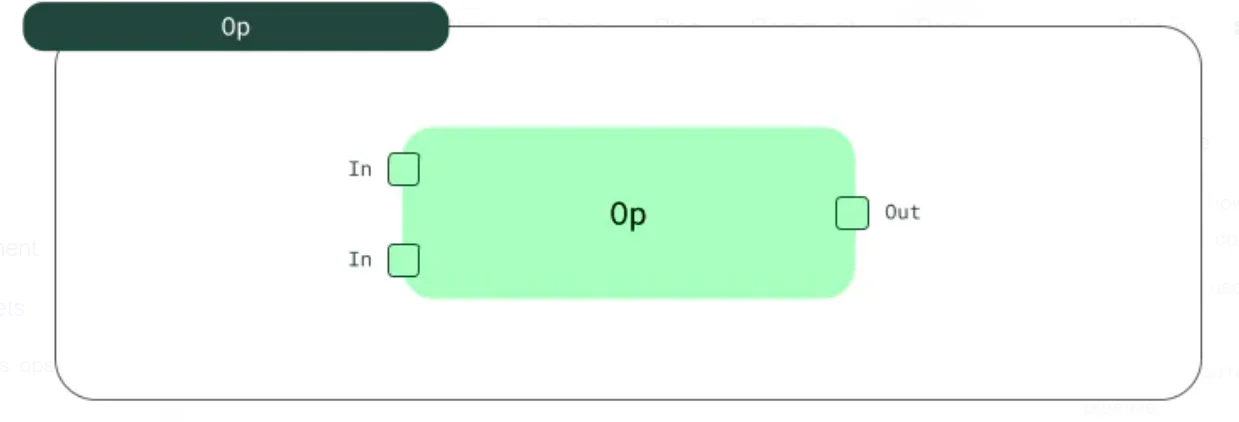
An op is the basic computational unit of an SDA - Source: Dagster Docs.
Unlike software-defined assets, ops aren’t connected to dependencies until they’re placed inside a graph.
Op graphs
Permalink to “Op graphs”An interconnected set of ops is a graph. Graphs help in accomplishing complex tasks.
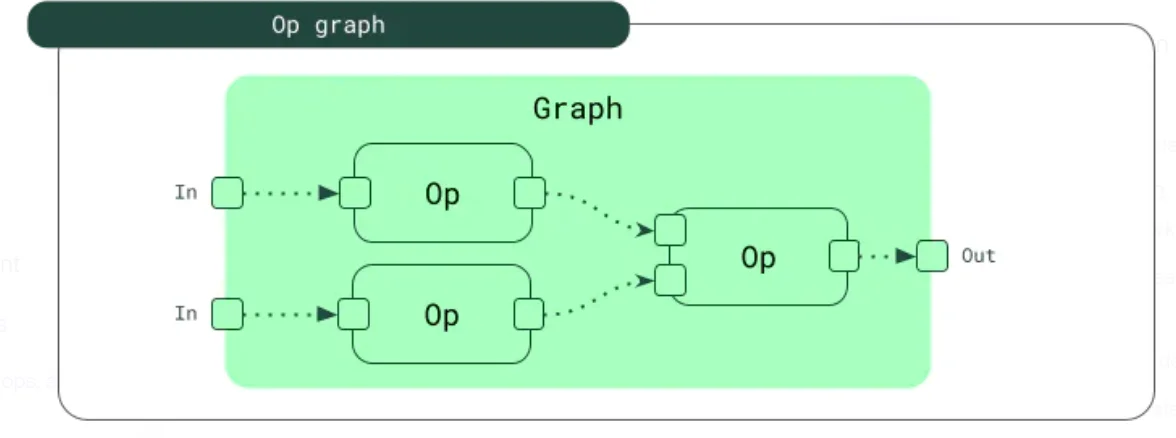
A graph in Dagster is a set of interconnected ops - Source: Dagster Docs.
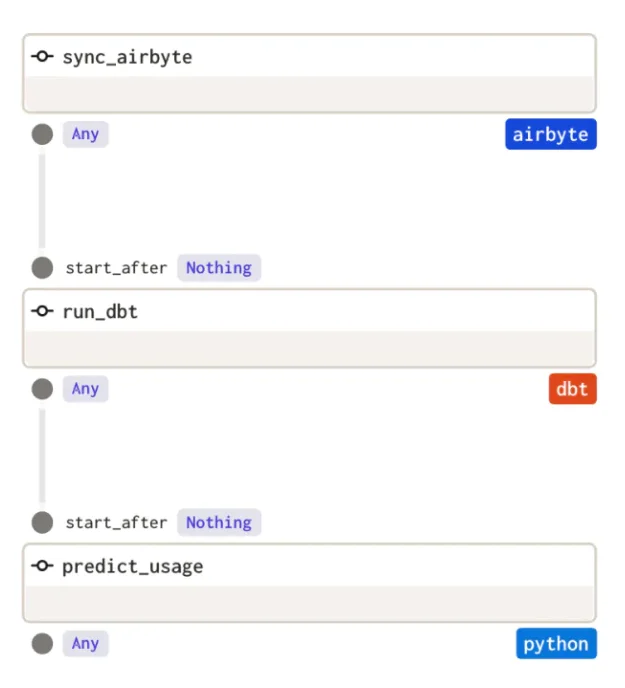
An op graph in Dagster - Source: Dagster Blog.
How does Dagster work?
Permalink to “How does Dagster work?”You can create a basic SDA using the @asset decorator. Meanwhile, you can use the @op decorator to define an op and the @graph decorator to define an op graph.
A decorator in Dagster is like a label you attach to a piece of code.
For assets with dependencies or complexities (i.e., multi-assets or graph-backed assets), Dagster provides a step-by-step setup guide here.
After defining the assets, you can:
- Load them into the webserver
- View them in the UI
- Build a job to materialize assets
A job in Dagster is the main unit of execution and monitoring. It either materializes SDAs or executes ops and graphs (that aren’t tied to SDAs).
Dagster’s architecture: An overview
Permalink to “Dagster’s architecture: An overview”A generic Dagster deployment consists of several processes, including three long-running services, configurable components, and several job execution processes:
- Long-running services
- Dagster webserver/UI
- Dagster daemon
- Code location server
- Dagster storage
- Job execution processes
- Run coordinators
- Run launchers
- Run workers
- Executors
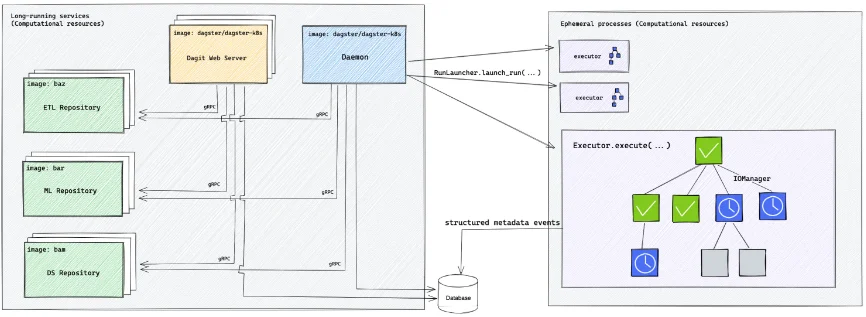
Dagster’s deployment architecture - Source: Dagster.
Let’s delve into the specifics of each process, starting with the long-running services.
Long-running services: Dagster webserver/UI
Permalink to “Long-running services: Dagster webserver/UI”The dagster-webserver serves the Dagster UI and responds to GraphQL queries.
The Dagster UI lets you view and interact with Dagster objects—inspect op, job, and graph definitions, launch and manage runs, view assets produced by those runs, etc.
The Dagster GUI is called Dagit.
The main pages inside the UI are:
- Jobs: Explore a job definition and launch runs for that job
- Runs: Lists all runs, which you can further filter by job name, run ID, execution status, or tag
- Assets: Lists all assets, which you can filter further by asset key
- Schedules: Lists all schedules and their details
- Sensors: Lists all sensors and their details
- Deployment overview: Displays information about code locations, definitions, daemons, and configuration details
The webserver/UI can have one or more replicas for scalability and fault tolerance. However, this requires using a Dagster daemon process to coordinate the execution of pipeline runs across multiple instances.
Replicas are like extra copies of the webserver, which help to handle more users at once and keep things running smoothly even if one part breaks down.
Long-running services: Dagster daemon
Permalink to “Long-running services: Dagster daemon”The dagster-daemon process manages schedules, sensors, and run queuing. It also performs periodic tasks such as cleaning up expired runs and updating asset materializations.
Asset materialization in Dagster saves the output to long-term storage for tracking and reuse, while also enabling triggers for related sensors or schedules.
The Dagster daemon reads from the Dagster instance file and a valid workspace file to determine which daemons should be included and which repositories should be accessed. Each of the included daemons then runs on a regular interval in its own thread.
Here’s a list of Dagster daemons that are currently available:
- Scheduler daemon: Creates runs from active schedules (a schedule executes a job at a fixed interval)
- Run queue daemon: Launches queued runs and backfill jobs, taking into account any limits and prioritization rules set on the instance
- Sensor daemon: Creates runs from active sensors (a sensor launches a run based on some external state change — a new job, file, or when issues crop up with an external system)
- Run monitoring daemon: Handles run worker (i.e., process) failures
Long-running services: Code location server
Permalink to “Long-running services: Code location server”A code location is a collection of Dagster definitions — assets, jobs, resources, schedules, and sensors. The code location server provides metadata on these Dagster definitions.
Definitions within a code location have a common namespace and must have unique names.
While you can have several code location servers, each code location can only have one replica for its server.
The code location server also loads the code into memory and updates it when changes are detected. It communicates with other components of the Dagster architecture over a Remote Procedure Call (RPC) mechanism to provide access to and use of the code that defines data pipelines.
Now, let’s look at Dagster storage and some of the processes involved in the job execution flow.
Dagster storage
Permalink to “Dagster storage”Dagster storage lets you define how job and asset history get persisted. The information captured includes metadata on runs, event logs, schedule/sensor ticks, and other useful data.
You have three storage options — SQLite (the default option), Postgres, and MySQL.
Job execution processes: Run coordinators
Permalink to “Job execution processes: Run coordinators”Run coordinators let you manage runs so that you can control the runs launched from the Dagster UI.
When you submit a run from the Dagster UI or the Dagster command line, it’s first sent to the run coordinator, which applies any limits or prioritization policies before eventually sending it to the run launcher to be launched.
Run coordinators can be built-in or custom.
Job execution processes: Run launchers
Permalink to “Job execution processes: Run launchers”A run launcher is the interface to the computational resources that will be used to execute Dagster runs. It initializes a new run worker to handle execution.
Run launchers spin up a new process, container, Kubernetes pod, etc.
Examples of built-in run launches include:
- The
DefaultRunLauncherlaunches pipeline runs within the same process or subprocess as the Dagster instance - The
K8sRunLauncherlaunches pipeline runs on a Kubernetes cluster - The
EcsRunLauncherlaunches an Amazon ECS task per job run
You can set up custom job launchers to account for custom infrastructure or APIs in your data stack.
Job execution processes: Run workers
Permalink to “Job execution processes: Run workers”A run worker is a process created by the run launcher. It traverses a graph and uses the executor to execute each op.
The run launcher defines the behavior of a run worker, whereas the executor handles the resources involved.
Job execution processes: Executors
Permalink to “Job execution processes: Executors”Executors help execute the steps within a job run. Executors are ops (i.e., functions) run in local processes, new containers, Kubernetes pods, etc.
They are invoked by the run worker for running user ops.
Examples of built-in executors include:
- The
in_process_executorexecutes all pipeline steps within the same process - The
multiprocess_executorexecutes pipeline steps in separate processes, using inter-process communication to coordinate between steps - The
celery_executor,docker_executor, and thek8s_executorexecute pipeline steps on distributed systems, such as Celery, Docker, or Kubernetes
You can also write your own custom executors. However, it’s not well-documented yet.
Dagster’s capabilities: An overview
Permalink to “Dagster’s capabilities: An overview”Dagster’s core capabilities as a data orchestrator include:
- A single interface to build, test, deploy, run, and iterate on data pipelines
- Declarative programming via software-defined assets (SDAs) for abstraction
- Shared, reusable, configurable data processing components
- Declarative scheduling to apply freshness policies
- Quality checks with Dagster types describing the values your pipelines accept and produce
- Asset versioning (for code and data) and caching
- A built-in observability dashboard to monitor pipelines
- Built-in testability
- Integrations with other tools in your data stack, such as Airflow, dbt, Databricks, Snowflake, Fivetran, Great Expectations, Spark, Pandas and Atlan
Dagster is still evolving and will include more capabilities in the future.
Getting started with Dagster
Permalink to “Getting started with Dagster”Here is a step-by-step plan on how to install Dagster and create your first project:
- Install Python 3.8+ and pip
- Install Dagster
- Create your first Dagster project
- Navigate to the project folder
- Install Python dependencies
- Verify installation by creating your first Dagster project
- To verify that it worked and that you can run Dagster locally, run
dagster devand navigate to localhost:3000. You should see the Dagster UI.
You can now create your own pipeline by writing your first asset.
Create data assets with Dagster: A crash course - Source: Youtube.
Summing up
Permalink to “Summing up”Dagster offers a declarative approach to data orchestration with software-defined assets and asset graphs. It aims to be a data control plane rather than a workflow scheduler for data engineers.
Alternatives include Airflow, Luigi, Prefect, and Argo. Choosing the right data orchestration tool would largely depend on your current data ecosystem and use cases.
Share this article


