


Microsoft Fabric and Power BI are two powerful tools from Microsoft designed for data management and analytics.
Watch Context Studio Demo
Microsoft Fabric serves as an integrated platform for data integration, engineering, and analytics. It enhances data workflows by providing a unified workspace.
In contrast, Power BI focuses primarily on data visualization and business intelligence reporting.
Understanding their differences is crucial for selecting the right tool for your organization’s needs.
Choosing the right data analysis tool can be tough with so many options available. Two popular choices are Microsoft’s Power BI and Microsoft Fabric.
Let’s dive into their functionality, design, security, industry focus, and more. We’ll also guide you on how to integrate these tools and address common queries.
Microsoft Fabric vs. Power BI: What’s the difference?
Permalink to “Microsoft Fabric vs. Power BI: What’s the difference?”Microsoft Fabric serves as a versatile and holistic solution for storing, managing, and analyzing data. It has seven workloads, such as Azure Synapse, Azure Data Explorer, and Power BI.
Power BI, on the other hand, concentrates mostly on data visualization and reporting. While it is also a part of Microsoft Fabric, it still functions independently.
Let’s take a closer look at their respective design, capabilities, use cases, and more.
Microsoft Fabric vs. Power BI: Architecture
Permalink to “Microsoft Fabric vs. Power BI: Architecture”Microsoft Fabric architecture overview
Permalink to “Microsoft Fabric architecture overview”Microsoft Fabric is built on OneLake, which serves as a storage layer for fetching data from cloud warehouses and lakes, such as the Microsoft platforms and Amazon S3. OneLake’s lakehouse architecture enables you to store all data in the open-source delta lake format, departing from traditional relational storage.
Overall, seven Microsoft Fabric workloads run on OneLake:
- Data Factory: The data integration service
- Synapse Analytics services: It offers Data Warehousing, Data Engineering, Data Science, and Real-Time Analytics
- Power BI: The business intelligence service
- Data Activator: The real-time monitoring service.

Microsoft Fabric’s architecture - Source: Microsoft.
Read more → Microsoft Fabric 101
Power BI architecture overview
Permalink to “Power BI architecture overview”Power BI is a tool for data visualization that helps you build reports and dashboards. Let’s look at the various components of Power BI:
- Power Query: A data connection technology that enables data transformation
- Power Pivot: An in-memory data modeling component
- Data Analysis Expressions or DAX: The formula language used in Power BI
- Power BI Report Server: The server-based platform that lets you publish Power BI reports within your organization’s firewall
- Power BI Gateway: A bridge between Power BI’s cloud service and on-premises data sources
- Power BI Visuals: Graphical elements, like charts and graphs, that visually represent data in a user-friendly way
Power BI supports desktop and mobile users with dedicated applications for each operating system.
Microsoft Fabric vs. Power BI: Architectural limitations
Permalink to “Microsoft Fabric vs. Power BI: Architectural limitations”Microsoft Fabric, being in the preview phase, may have limited support for certain data visualization and reporting features compared to the standalone, full-fledged Power BI platform.
Customization options in Microsoft Fabric might also be more restricted, making it time-consuming to create unique components outside the standard library.
Furthermore, sensitivity label inheritance (i.e., a feature that automatically maintains data sensitivity labels) upon export is currently supported only for Power BI items in specific export paths.
Other Microsoft Fabric experiences potentially lack the same level of support for transferring sensitivity labels to exported outputs (i.e., data sets that are created and saved out of the original system or tool).
On the other hand, the standalone Power BI tool encompasses various components as mentioned earlier. It can be challenging to figure out which component is ideal for which use case.
Additionally, troubleshooting issues within Power BI can be time-consuming due to the absence of movable parts (i.e., the ability to modify or adjust individual components or elements within the tool), leading to an increased total cost of ownership (TCO).
Another Power BI limitation to note is that it’s designed to work well with other Microsoft products. It may not integrate as smoothly with non-Microsoft technologies.
Microsoft Fabric vs. Power BI: Capabilities
Permalink to “Microsoft Fabric vs. Power BI: Capabilities”While both tools are data-focused, they serve different purposes in the data pipeline. Microsoft Fabric covers a broader spectrum of data integration and processing. Meanwhile, Power BI concentrates on your data asset’s end usage.
Let’s explore this further.
Microsoft Fabric capabilities
Permalink to “Microsoft Fabric capabilities”With Microsoft Fabric, you can:
- Automate data movement and transformation
- Store and analyze large volumes of data in a centralized lakehouse
- Build, train, and deploy machine learning models
- Process and analyze data in real-time
- Visualize and analyze data through reports and dashboards
You can manage all of your Fabric resources in your own dedicated space, called a tenant. A tenant in Microsoft Fabric is essentially your organization’s instance of Fabric, providing a secure and isolated environment to house all your data, users, services, and resources.

Microsoft Fabric tenant. - Source: Microsoft.
You can also leverage AI services in your workflows, and upcoming conversational language support will make it even easier to interact with the system for business users.
Power BI capabilities
Permalink to “Power BI capabilities”With Power BI, you can integrate, transform, and visualize data. For instance, you can use Power BI Desktop to create visually appealing and interactive reports using various visualization options. You can then publish these reports to the cloud-based Power BI Service, enabling collaboration and sharing with stakeholders.
Power BI also allows you to build interactive dashboards, offering consolidated views of key metrics and visualizations. You can interact with the dashboards to explore and analyze data through filtering and slicing.

Interactive dashboards for Power BI’s business users - Source: Microsoft.
Microsoft Fabric vs. Power BI: General limitations associated with capabilities
Permalink to “Microsoft Fabric vs. Power BI: General limitations associated with capabilities”Let’s look at the general capability limitations you might experience when using Microsoft Fabric and Power BI.
Currently, Microsoft Fabric is reported to face some limitations and considerations when it comes to information protection capabilities, including manual labeling, default labeling, mandatory labeling, and inheritance. The support for these capabilities may vary for different Microsoft Fabric items.
Another limitation to be aware of is that the Microsoft Fabric (Preview) trial capacity does not support autoscale (i.e., a capability that dynamically alters computing resources like processing power or storage space when required).
Meanwhile, Power BI has restrictions when it comes to custom visual development. It provides numerous built-in visuals, but creating your own requires coding knowledge (JavaScript). Furthermore, Power BI has certain boundaries when it comes to processing data. For example, [Power BI Pro can only handle up to 10GB of data per user](https://powerusers.microsoft.com/t5/Power-Query/Power-BI-pro-Clarification-on-10-GB-limit/m-p/1022151#:~:text=With Power BI Pro %2C we,usage of extensive accumulated space .).
Microsoft Fabric vs. Power BI: Security and governance
Permalink to “Microsoft Fabric vs. Power BI: Security and governance”Microsoft Fabric security and governance
Permalink to “Microsoft Fabric security and governance”For data security, Microsoft Fabric is equipped with:
- Conditional Access: Allows you to control access based on user identity and location
- Regional Resiliency: Ensures data reliability through replication across Azure availability zones
- Lockbox: Gives you explicit approval control over Microsoft engineers’ access to your data
Meanwhile, for governance and compliance, Fabric offers Information Protection to discover, classify, and protect data with sensitivity labels. For example, Data Loss Prevention (DLP) policies detect and protect sensitive data in Power BI datasets, generating alerts and policy tips.
Moreover, the Microsoft Purview hub centrally manages Fabric data, offering reports, Information Protection, DLP, and Audit capabilities mentioned above.
Power BI security and governance
Permalink to “Power BI security and governance”In comparison to Microsoft Fabric’s Conditional Access and Lockbox, Power BI uses Role-Based Access Control (RBAC) and Row-Level Security (RLS) for more granular data access control. Other features include:
- Data classification and sensitivity labels
- Auditing and monitoring capabilities
- Data governance features like dataset certification, data lineage, and impact analysis
- Scheduled data refresh
- Collaboration and sharing functionalities
These features collectively enable you to secure your data, enforce access controls, track user activities, ensure data accuracy, and collaborate effectively within a secure environment.
Microsoft Fabric vs. Power BI: Use cases
Permalink to “Microsoft Fabric vs. Power BI: Use cases”Microsoft Fabric use cases
Permalink to “Microsoft Fabric use cases”You can use Microsoft Fabric to manage large volumes of structured data, simplify data integration, support end-to-end data science workflows, enable real-time analysis, and facilitate accurate predictions for future trends.

Microsoft Fabric for Data Engineer, Data Scientist, Data Analysts, Data Citizens, and Data Sterwards - Source: Adatis.
Read more → Microsoft Fabric use cases
Power BI use cases
Permalink to “Power BI use cases”Power BI supports a range of use cases for data analysis and visualization. With a variety of visualization options and real-time analytics, data practitioners can communicate insights and monitor evolving trends.
Power BI also integrates with machine learning tools for predictive analysis.

Prediction Model Validation Report in Power BI. - Source: Microsoft.
Although there’s some overlap in use cases, Microsoft Fabric is more about the backend management and preparation of data, whereas Power BI is geared towards analyzing and visualizing that data to derive insights.
Integrating Microsoft Fabric with Power BI: Here’s what you need to know
Permalink to “Integrating Microsoft Fabric with Power BI: Here’s what you need to know”Power BI is already integrated into Microsoft Fabric. Here’s a step-by-step guide to help you out:
- Prerequisites: Sign up for a free trial of Microsoft Fabric and create a new workspace with assigned Fabric capacity. Download the Power Query template file containing sample Contoso data.
- Create a Lakehouse: In your workspace, go to “New” and select “Lakehouse” under Data Engineering. Name your Lakehouse (e.g., “SalesLakehouse”) and create it.
- Prepare and load data into the Lakehouse: Access the Lakehouse editor and use Dataflows Gen2. Open the Power Query Online editor and import the Contoso template file. Choose specific queries (e.g., “DimDate”) and configure connections. Make any necessary transformations and repeat for other queries (e.g., “DimCustomer,” “DimEmployee,” etc.).
- Add a data destination: Select each table (e.g., “DimDate”) and click “Add data destination” from the Home tab. Choose “Lakehouse” as the destination, set authentication, select SalesLakehouse, and specify the update method (e.g., “Replace” or “Append”). Save the settings for each table.
- Orchestrate a data pipeline: Create a new pipeline within the Lakehouse editor. Add a pipeline activity and choose “Dataflow” as the type. Configure the activity by specifying the OnlineSalesDataflow. Add additional activities as needed, like an Office365 Outlook activity for email notifications. Configure settings (such as recipients and email subjects), save the pipeline and schedule it to run at a specific time or interval.
- Create a semantic model: Access the SQL Endpoint of the SalesLakehouse in your workspace. In Explorer, select the SQL Endpoint item and switch to the Model view. Establish relationships between tables by dragging and dropping columns. For example, connect the CustomerKey column from FactOnlineSales to the CustomerKey column in DimCustomer. Repeat for other tables like DimProduct, DimStore, and DimDate.
How organizations making the most out of their data using Atlan
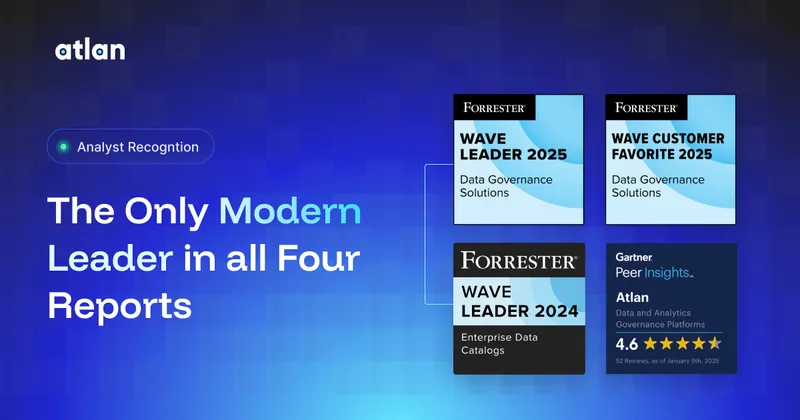
Permalink to “How organizations making the most out of their data using Atlan”The recently published Forrester Wave report compared all the major enterprise data catalogs and positioned Atlan as the market leader ahead of all others. The comparison was based on 24 different aspects of cataloging, broadly across the following three criteria:
- Automatic cataloging of the entire technology, data, and AI ecosystem
- Enabling the data ecosystem AI and automation first
- Prioritizing data democratization and self-service
These criteria made Atlan the ideal choice for a major audio content platform, where the data ecosystem was centered around Snowflake. The platform sought a “one-stop shop for governance and discovery,” and Atlan played a crucial role in ensuring their data was “understandable, reliable, high-quality, and discoverable.”
For another organization, Aliaxis, which also uses Snowflake as their core data platform, Atlan served as “a bridge” between various tools and technologies across the data ecosystem. With its organization-wide business glossary, Atlan became the go-to platform for finding, accessing, and using data. It also significantly reduced the time spent by data engineers and analysts on pipeline debugging and troubleshooting.
A key goal of Atlan is to help organizations maximize the use of their data for AI use cases. As generative AI capabilities have advanced in recent years, organizations can now do more with both structured and unstructured data—provided it is discoverable and trustworthy, or in other words, AI-ready.
Tide’s Story of GDPR Compliance: Embedding Privacy into Automated Processes
Permalink to “Tide’s Story of GDPR Compliance: Embedding Privacy into Automated Processes”- Tide, a UK-based digital bank with nearly 500,000 small business customers, sought to improve their compliance with GDPR’s Right to Erasure, commonly known as the “Right to be forgotten”.
- After adopting Atlan as their metadata platform, Tide’s data and legal teams collaborated to define personally identifiable information in order to propagate those definitions and tags across their data estate.
- Tide used Atlan Playbooks (rule-based bulk automations) to automatically identify, tag, and secure personal data, turning a 50-day manual process into mere hours of work.
Book your personalized demo today to find out how Atlan can help your organization in establishing and scaling data governance programs.
Microsoft Fabric vs. Power BI: Concluding thoughts
Permalink to “Microsoft Fabric vs. Power BI: Concluding thoughts”Both Microsoft Fabric and Power BI are tools for data analysis and visualization, each with its own strengths and ideal use cases.
Microsoft Fabric aims to be an end-to-end platform for data and analytics. It can process large volumes of data, supports open data formats, and is equipped with AI to enable analytics for all data practitioners.
Power BI, on the other hand, specializes in interactive data visualization and business intelligence reporting. Its user-friendly interface and comprehensive visualization tools make it ideal for business analysts and decision-makers.
While these tools have their own strengths, they are designed to be used together for a more comprehensive data solution. For instance, Microsoft Fabric can be used to ingest, process, and transform large volumes of data, while Power BI helps visualize that data for reporting.
FAQs about Microsoft Fabric vs Power BI
Permalink to “FAQs about Microsoft Fabric vs Power BI”1. What are the key differences between Microsoft Fabric and Power BI?
Permalink to “1. What are the key differences between Microsoft Fabric and Power BI?”Microsoft Fabric and Power BI are products from Microsoft that play distinct roles in an enterprise’s data analytics journey.
Microsoft Fabric is an integrated solution that combines various Microsoft applications in data integration, engineering, analytics, and business intelligence to build a single workspace for data practitioners.
On the other hand, Power BI (which is a part of the Microsoft Fabric platform) is a dedicated business intelligence tool for visualizing data and generating actionable insights.
2. In which scenarios should I use Microsoft Fabric instead of Power BI?
Permalink to “2. In which scenarios should I use Microsoft Fabric instead of Power BI?”If your needs extend beyond business intelligence and require services such as data movement, data engineering, real-time analytics, and data science, then Microsoft Fabric is the more comprehensive solution.
If, however, you primarily need a tool for data visualization and business intelligence, Power BI is good enough.
3. Can Power BI be used in conjunction with Microsoft Fabric?
Permalink to “3. Can Power BI be used in conjunction with Microsoft Fabric?”Yes, Power BI is a part of the Microsoft Fabric platform and is used for business intelligence within the larger Microsoft Fabric ecosystem.
4. What is Microsoft Fabric, and how does it differ from Power BI?
Permalink to “4. What is Microsoft Fabric, and how does it differ from Power BI?”Microsoft Fabric is an integrated solution that combines various Microsoft applications for data integration, engineering, and analytics. Power BI, a part of Microsoft Fabric, focuses specifically on data visualization and business intelligence reporting.
5. How can Microsoft Fabric enhance data integration compared to Power BI?
Permalink to “5. How can Microsoft Fabric enhance data integration compared to Power BI?”Microsoft Fabric provides a unified platform for managing data workflows, allowing for seamless integration of various data sources. In contrast, Power BI primarily focuses on visualizing data rather than integrating it.
6. What are the key features of Power BI that are not available in Microsoft Fabric?
Permalink to “6. What are the key features of Power BI that are not available in Microsoft Fabric?”Power BI offers advanced data visualization tools, interactive dashboards, and a user-friendly interface specifically designed for business intelligence reporting, which may not be fully available in Microsoft Fabric.
7. What are the use cases for Microsoft Fabric in enterprise environments?
Permalink to “7. What are the use cases for Microsoft Fabric in enterprise environments?”Microsoft Fabric is ideal for managing large volumes of structured data, supporting end-to-end data science workflows, and enabling real-time analytics, making it suitable for various enterprise applications.
8. How do Microsoft Fabric and Power BI handle data security and compliance?
Permalink to “8. How do Microsoft Fabric and Power BI handle data security and compliance?”Microsoft Fabric includes features like Conditional Access and Information Protection for data security. Power BI utilizes Role-Based Access Control (RBAC) and Row-Level Security (RLS) to ensure granular data access control.
9. Can Power BI be used in conjunction with Microsoft Fabric?
Permalink to “9. Can Power BI be used in conjunction with Microsoft Fabric?”Yes, Power BI is integrated into Microsoft Fabric, allowing users to leverage both tools for comprehensive data management and visualization.
