Headless BI 101: Common Terms, Design, Components, Future Outlook & More

Share this article
Introduction
Permalink to “Introduction”Headless BI is an emerging concept and a relatively new component of the modern data platform. It was developed primarily to solve the challenges of decentralized metrics definitions and calculations.
Here we aim to give you a foundational understanding of the common terms associated with Headless BI — some traditional metrics computation methods, and the possible ways in which Headless BI attempts to solve the problems in these methods.
We will also take a look at the Headless BI architecture in detail along with a sneak peek at how Headless BI (when done right) might lead us to new and exciting ways of consuming metrics.
Modern data problems require modern solutions - Try Atlan, the data catalog of choice for forward-looking data teams! 👉 Book your demo today
What is Headless BI?
Permalink to “What is Headless BI?”Headless BI is the component that sits between the data warehouse and metrics-consuming tools, thus creating a layer of abstraction between the definition and presentation of metrics. Headless BI holds all the metrics definitions, intercepts metrics requests issued by analytical tools, translates them into SQL, and then runs them against the data warehouse.
Most organizations struggle with the challenge of unreliable reporting as metrics definitions and logic get scattered and become inconsistent over time across teams and tools. Headless BI tools were developed to meet this challenge and achieve consistent reporting across the board.
Headless BI: Common terms and their definitions
Permalink to “Headless BI: Common terms and their definitions”Some common terms associated with Headless BI include:
- Facts, Measures, Dimensions
- Metrics
- Metrics Layer
- Semantic Layer
Let’s now understand these briefly:
Facts, Measures, Dimensions
Permalink to “Facts, Measures, Dimensions”Facts are events that a business is interested in. For example visits to an e-commerce store, a list of bookings for a hotel, etc. Facts are associated with a point in time.
Facts have quantitative attributes on which further statistical calculations can be made. These attributes are called measures. For example, every hotel booking (fact) includes quantitative information like the number of guests (measure), room tariff (measure), and so on.
While measures are the quantitative attributes of facts, dimensions are their qualitative attributes.
Dimensions usually include information like people, place, time, product, etc., about facts. They can later be used as filters to segment, categorize and understand data (usually referred to as slicing and dicing of data) to make meaningful conclusions about the state of the business.
In our hotel booking example, dimensions could include information like the time of booking, place of booking, whether the booking happened online/offline, etc.
Metrics
Permalink to “Metrics”Metrics are attributes that provide meaning to measures by creating a context for them.
In our hotel booking example, the “rate of cancellation” is a metric calculated by using the measures “number of cancellations” and “total number of bookings” over a specific period.
The terms metrics and measures are often confused with each other. Here is a great description by SimpleKPI.com that helps us understand the difference between them:
The most obvious difference between metrics and measures is that measures are a fundamental unit that in and of itself provides very little information. If you were to receive a report that simply said, “We sold three hundred units,” it would not be an especially useful report. Three hundred units of what? Over what time frame? Were all the units completed sales or were any returned? Metrics bring together measures with other data points to make them tell a story. If the above report said, “We sold three hundred units of product X over the last quarter,” you now have a more substantial picture of how things are going.
Some tools like Tableau, Looker, and Cube.js however, do not differentiate between metrics and measures and use the terms interchangeably.
Metrics Layer
Permalink to “Metrics Layer”The metrics layer is synonymous with Headless BI and the two terms are often used interchangeably. However, some industry experts define them in a more granular manner.
Semantic Layer
Permalink to “Semantic Layer”The semantic layer is the component that translates business entities to the underlying tables/columns in the data warehouse and vice versa.
Raw data in the warehouse is structured to enable optimal storage and processing. Business users and tools do not always find it easy to understand or use the data structured in this way. The semantic layer solves this problem by mapping the tables/columns to dimensions, measures, and metrics.
Even though the Semantic layer is sometimes confused with the Metrics layer (or Headless BI), it is only one of the components of the Metrics layer. The metrics layer also includes components like a Metrics server, API, and Query generator.
Learn how data teams around the world use Atlan to bring their data to life
Join us on Thursdays, 11 am EST
Metrics and how they are computed
Permalink to “Metrics and how they are computed”The fundamental goal of Data Analytics is to use data to make business decisions. Businesses define metrics to help make sense of the data they collect. These metrics reflect the key performance indicators of the business.
For example, if one of the metrics of interest happens to be the monthly customer churn rate, it would be necessary to measure the number of customers at the start, as well as at the end of the month, to be able to compute the metric. This metric can be further sliced and diced using dimensions like customer segments, geography, etc., to gain deeper insights and make useful business decisions.
Let us further understand this process with the help of an example.
Here is a dataset of hotel bookings (reservations) sourced from the article Hotel Booking Demand Datasets (by Nuno Antonio, Ana Almeida, and Luis Nunes for Data in Brief, Volume 22, February 2019)

Hotel bookings dataset. Source: by Nuno Antonio, Ana Almeida, and Luis Nunes for Data in Brief, Volume 22, February 2019
The metric, monthly reservations (sliced by country) could be computed by running the following SQL:

SQL query for calculating a new metric: Monthly reservations by country
The resulting table would look like this:

New calculated metric: Total reservation by country
This table provides insights about where most of the business comes from and how it varies over time - whether the hotel is more/less popular with guests from certain geographies, in summer as opposed to the winter months. Such insights help to tailor marketing and CRM efforts and target them toward the right customer segment.
Another metric, the monthly rate of cancellation can be computed by running:
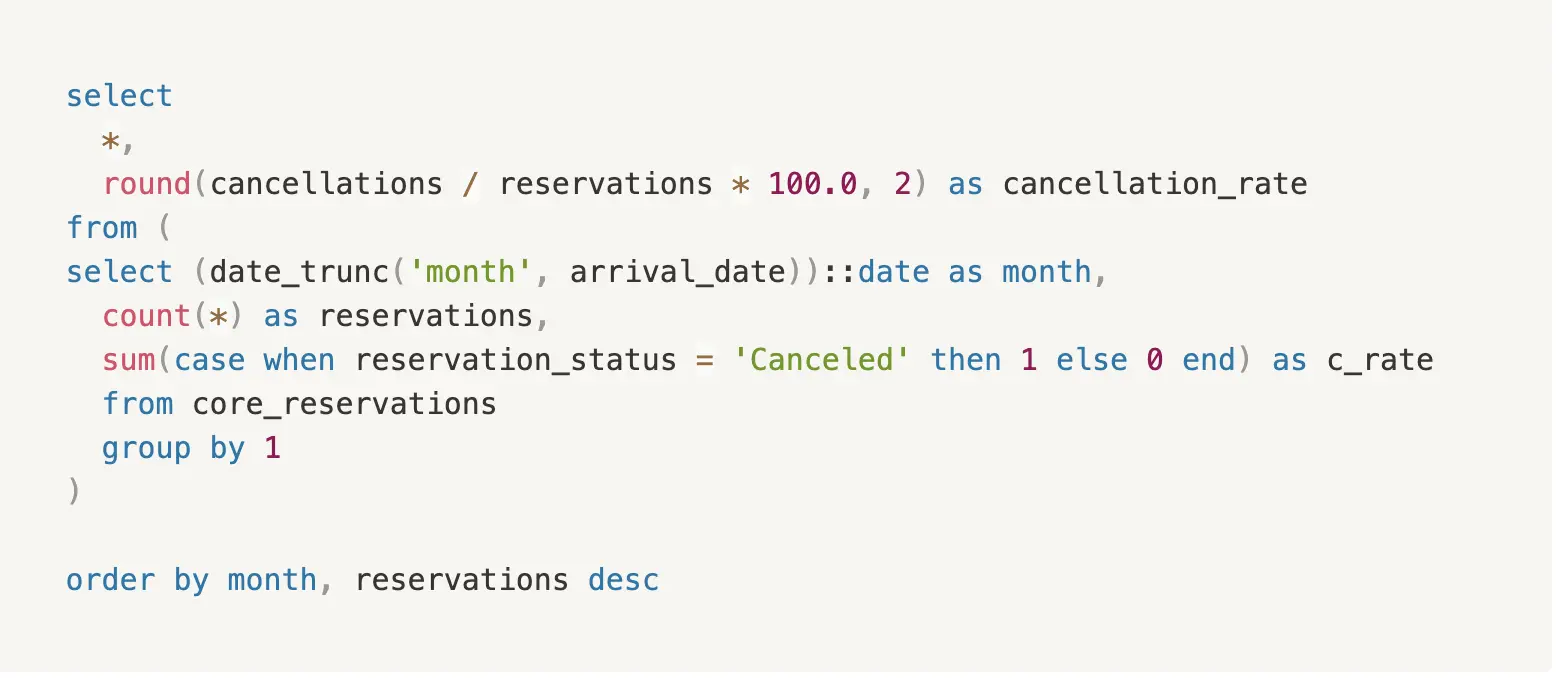
SQL query to calculate a new metric: Monthly rate of cancellations
The resulting table would look like this:

New calculated metric: Monthly cancellation rate
This information helps to understand how the cancellation rate varies from one month to the other. The data can be further sliced and diced using dimensions like country of origin or lead time between booking and stay to determine what factors might be affecting the rate of cancellation. Such insights help with corrective actions to reduce cancellations. For instance, the hotel might decide to encourage rescheduling over cancellations, or the hotel might even provide special offers to customers during certain months to incentivize travel and improve booking retention.
Until recently, metric queries like the ones above were expensive to run - especially on large datasets. To speed this up, data teams pre-aggregated commonly used metrics and stored them as tables, which could then be queried on demand. These pre-aggregated tables are called OLAP cubes.
OLAP cubes
Permalink to “OLAP cubes”OLAP stands for Online Analytical Processing system (such as a data warehouse). The term cube refers to the fact that there are often multiple dimensions against which a measure is pre-aggregated.
OLAP cubes are efficient because the metrics are pre-computed. But this efficiency comes at the cost of flexibility because cubes are only periodically updated to reflect new in-coming facts. Additionally, cubes have to be re-designed each time more dimensions are required to be added.
Despite these limitations, OLAP cubes remain a popular choice. They are fast to query and easy to understand. This is why many data warehouses have native SQL support for generating complex cubes. For example, running the following SQL:

SQL queries to generate OLAP cubes
generates a 2-dimensional cube as follows:

Computed 2 dimensional OLAP cube
BI Tools
Permalink to “BI Tools”BI Tools like Tableau, Looker, and PowerBI make it easy for data analysts to define, compute and display metrics, all within the same GUI. This is perhaps why BI tools have become the de facto method for metrics computation.
In the example below, Tableau Desktop is used to define the dimensions and measures (using the same hotel reservations data as in the previous example), compute the metrics of monthly reservations and cancellations sliced by countries, and display the results as a visually informative graph.
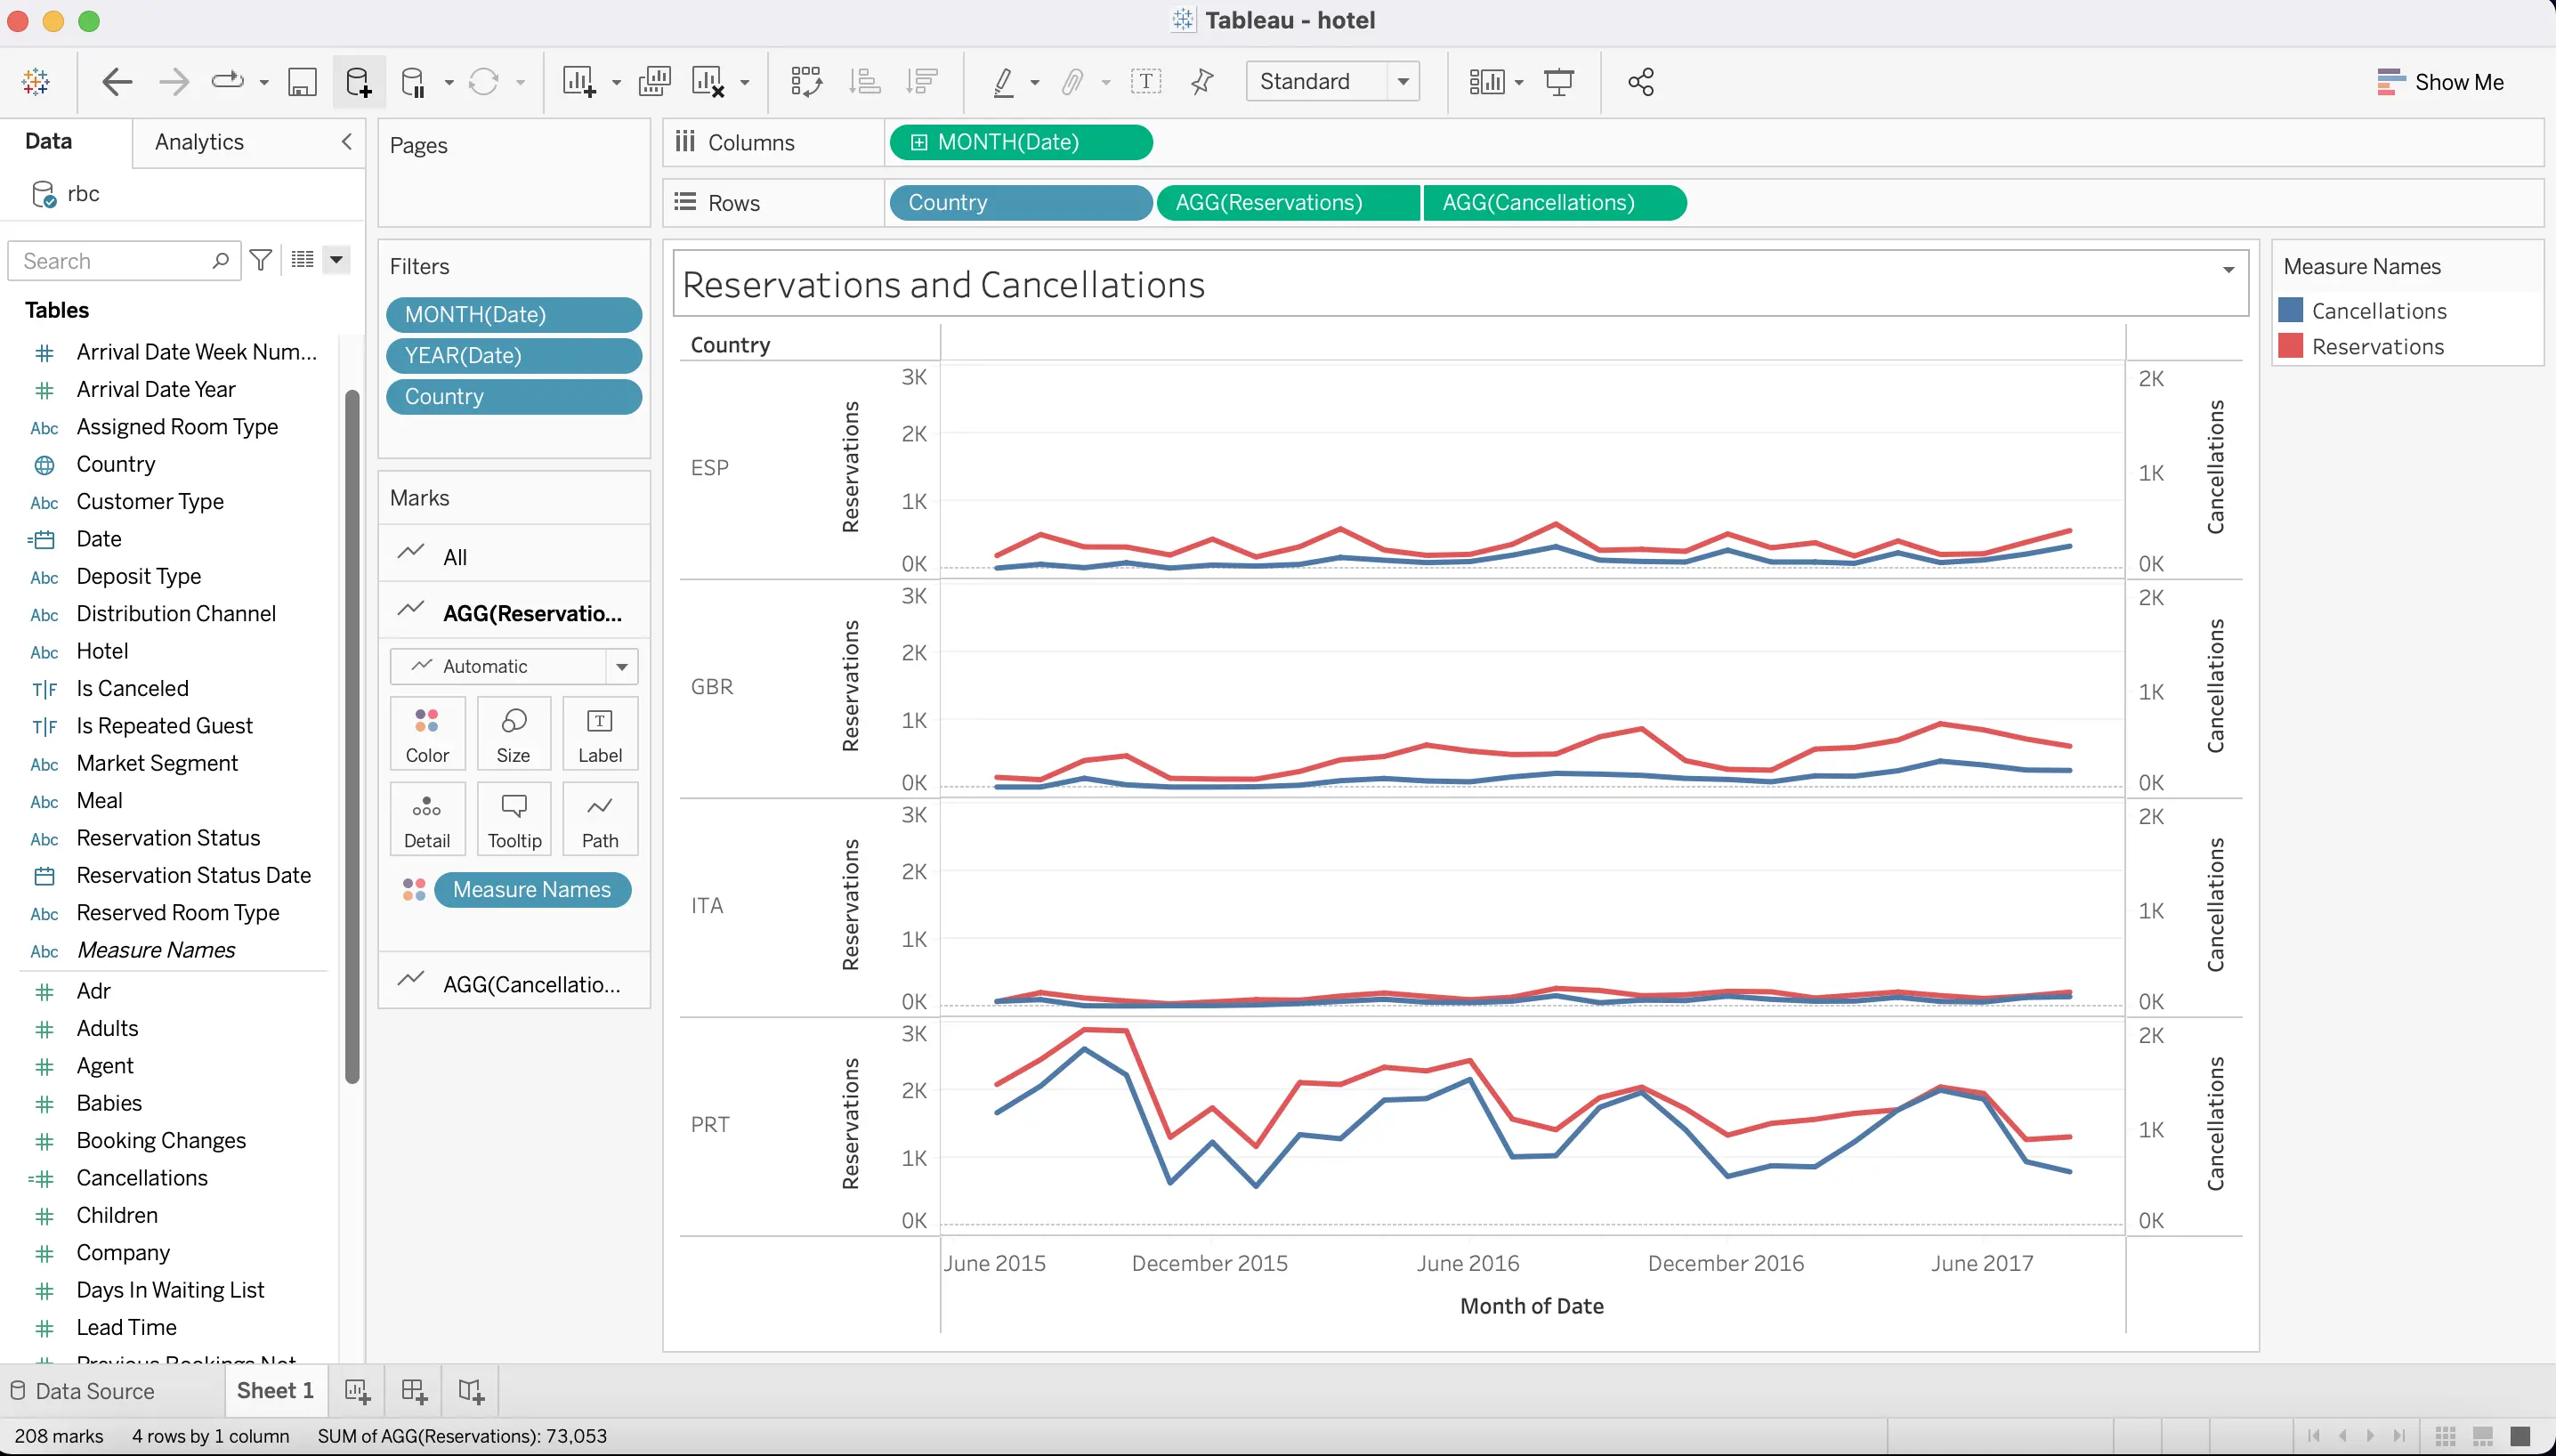
Using Tableau to compute monthly reservation and cancellation metrics
Despite its ease of use, this approach has many limitations. Let’s look at what they are, in the following section.
Challenges in metrics computation
Permalink to “Challenges in metrics computation”When a company grows, it gets harder for its teams to agree on the definitions of metrics. The problem becomes even more pronounced in the absence of a common semantics layer, which, until recently, was not a standard component of BI tools. Even basic definitions like fiscal year, time zone, etc., become confusing and contentious. The problem gets worse with more complex metrics. In his article The missing piece of the modern data stack, Benn Stancil describes this problem as follows:
“The core problem is that there’s no central repository for defining a metric. Without that, metric formulas are scattered across tools, buried in hidden dashboards, and recreated, rewritten, and reused with no oversight or guidance”
Besides, the metrics logic embedded within one tool cannot be accessed or consumed by other tools in the ecosystem. For example, a CRM system looking to use the booking cancellation rate may not be able to directly run the computation query within the BI tool or use its output.
BI tools also make it harder for data teams to adopt software engineering practices like version control, testing and CI/CD. Since BI tools do not lend themselves well to these paradigms, teams cannot take full advantage of these best practices despite their well-established benefits.
How Headless BI promises to solve the problem
Permalink to “How Headless BI promises to solve the problem”Headless BI solves the above problems by providing a universally accessible, central repository for metrics logic. Instead of being embedded inside a BI tool or scattered across other tools in the organization, the metrics definitions are housed in the Headless BI. Operational systems and BI tools can connect to Headless BI over APIs to trigger computations.
Also, the semantic layer embedded within Headless BI tools allows for clear and reusable business definitions, further promoting consistency. Headless BI tools also have strong data governance features such as access control, metrics discovery, and version management. All these make for a healthy metrics ecosystem, promoting consistency and standardization across teams and tools.
Headless BI: Design and components
Permalink to “Headless BI: Design and components”Headless BI implements the fundamental software design principles of decoupling and abstraction by creating a layer of indirection between metrics consumers and data warehouses. This gives data teams the freedom to connect more than one BI tool or operational system to the central metrics server. Headless is an adjective given to software systems that do not have a graphical user interface attached.
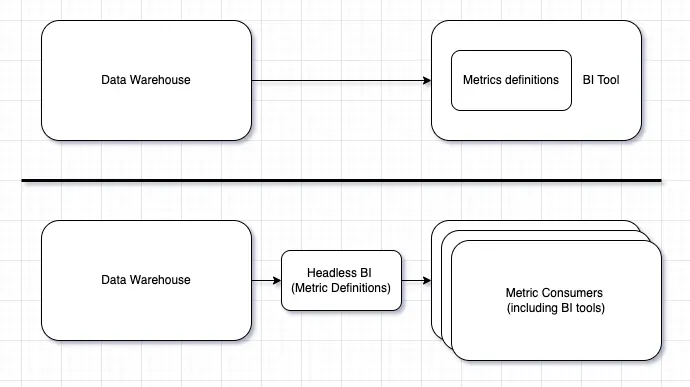
Headless BI: An abstraction layer of metrics between data warehouses and metric consumers
One of the earliest known implementers of Headless BI was Airbnb. Airbnb developed an internal Headless BI system called Minerva to overcome the problem of metrics mismanagement. Minerva is a configurable, highly performant and scalable platform that powers most of their metrics computation needs. Airbnb later published a series of in-depth blog posts explaining the motivation and architecture of the system.
“For data consumption, we heard complaints from decision makers that different teams reported different numbers for very simple business questions, and there was no easy way to know which number was correct”
Meanwhile, LookML and dbt reinforced the benefits of configuration-driven model definitions. This inspired the data community to wean itself away from monolithic vertical BI platforms and adopt a metrics-as-code approach.
These experiments and learnings are strongly reflected in the current development of Headless BI systems.
Most Headless BI systems have a modular architecture with the following core components:
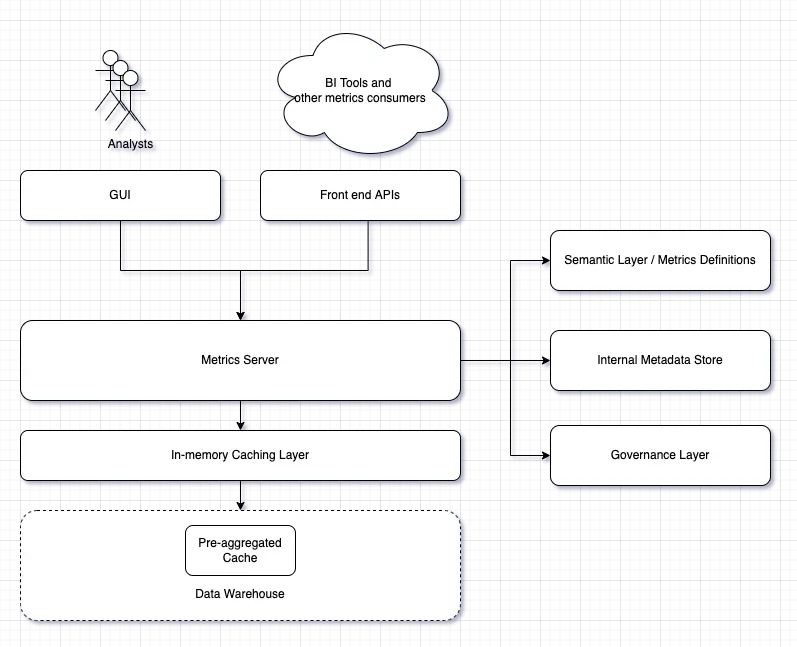
Components and architecture of Headless BI
Semantic Layer (Metrics Definitions)
Permalink to “Semantic Layer (Metrics Definitions)”The semantic layer is a metastore that maps the tables and columns in the data warehouse to meaningful business entities. It is sometimes also called the logical model. This is where businesses can define dimensions, measures, and metrics important to them in a business-friendly language. This layer is also used to define relationships between various business entities.
In a well-designed Headless BI tool, metrics definitions live in version-controlled text files (usually YAML or JSON). The tool also includes a workflow feature that only allows peer-reviewed changes to these files. Typically, the tool creates the first-level logical model using the information schema of the data warehouse. This can then be modified or overridden as required.
Cube.js uses JSON for metrics definitions. LookML uses a file format similar to JSON. Metriql, dbt and Transform’s semantic layer MetricFlow all use YAML for authoring and storing metrics definitions. Tableau, ThoughtSpot and a few other tools use GUI interfaces instead of text files.
Here is a sample metric definition JSON file from cube.js:

Metric definition stored as JSON file in cube.js
dbt’s YAML-based metrics look similar.
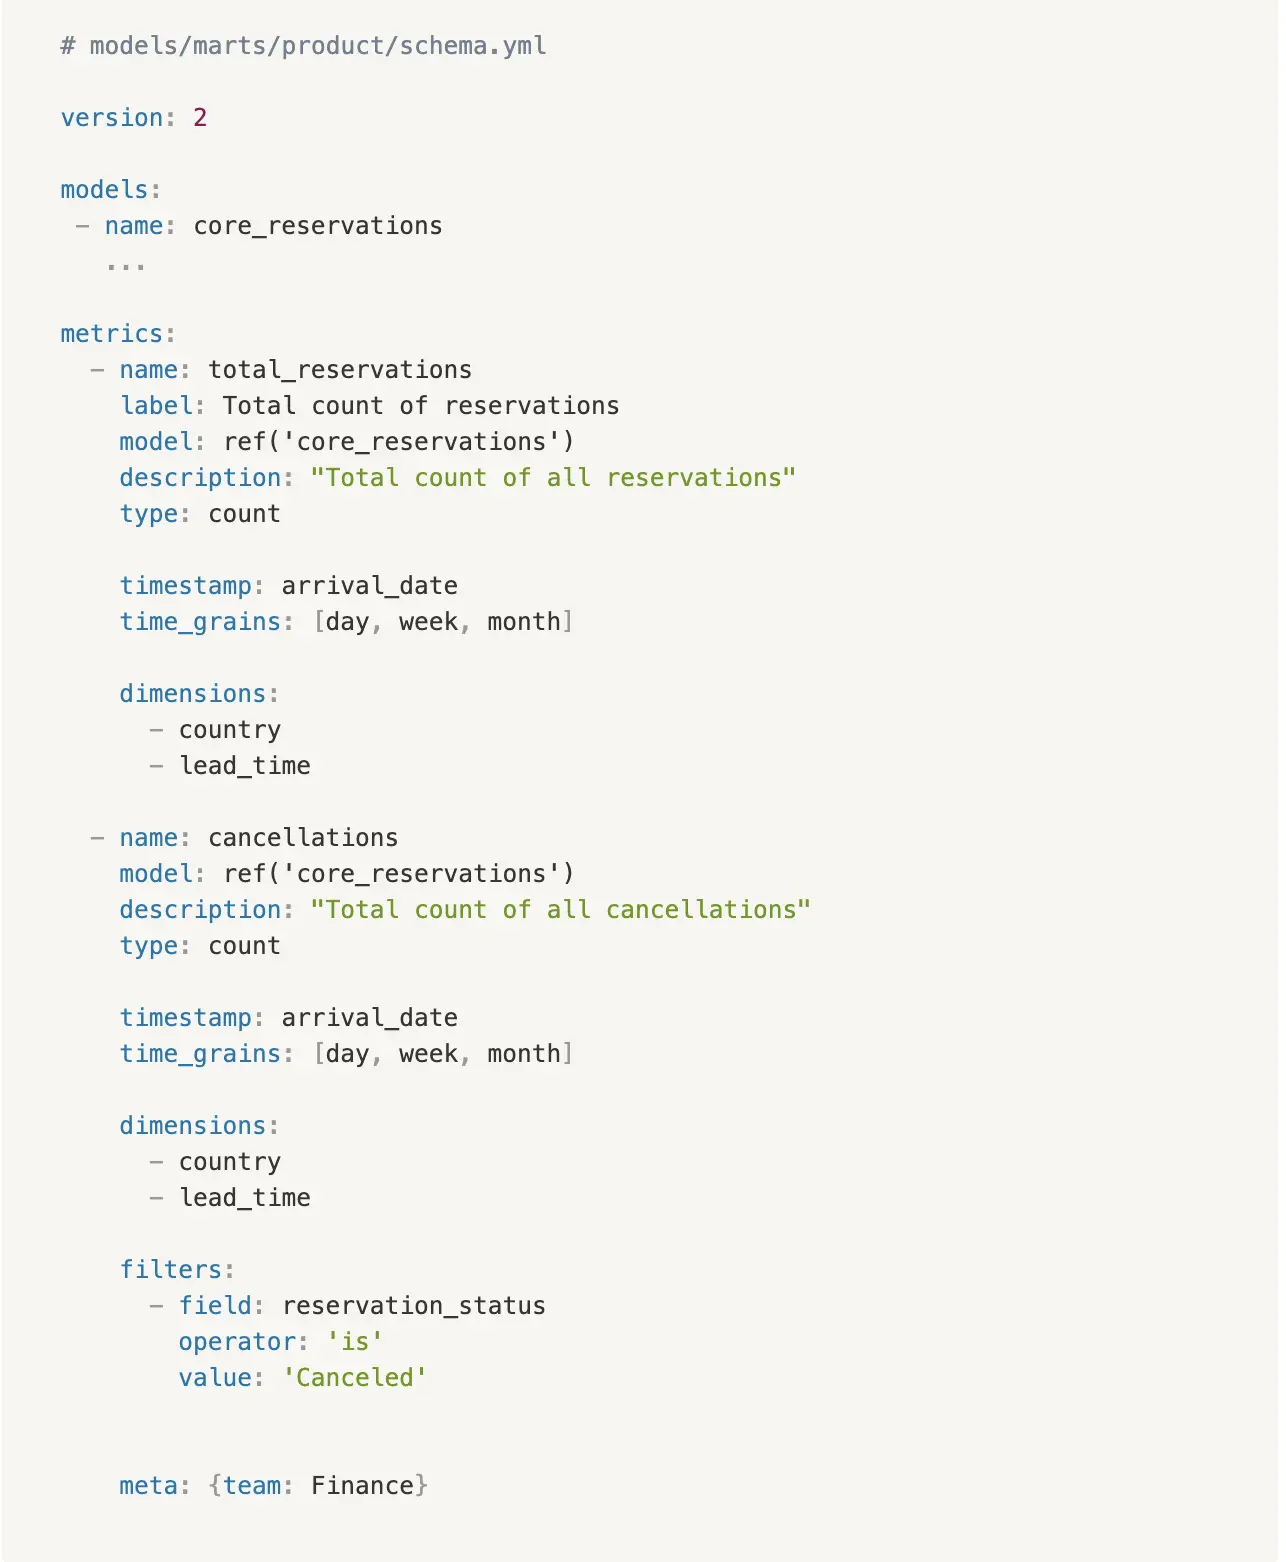
Metric definition stored as YAML file in dbt
Metrics Server and APIs
Permalink to “Metrics Server and APIs”Using the logical model, the metrics server converts API requests (metric computation requests) to raw SQL queries (query generation) and runs them against the data warehouse (computation). The operational systems and BI tools can interact with the metrics server in one (or more) of the following ways:
- SQL
- REST API
- GraphQL API
- GUI
- CLI
Metrics computation requests
Of all the currently available interfaces, SQL is by far the most popular choice. Since SQL is the language of BI tools, it makes it possible for nearly every BI tool to connect to the Metrics server. Headless BI systems behave like proxy database servers to these BI tools.
Note that the SQL dialects supported by most Headless BI tools are not fully ANSI compliant.
Transform and Minerva use Apache Calcite Avatica’s JDBC driver to implement the SQL interface while Metriql uses Trino’s JDBC driver to get there. Cube.js emulates a Postgres-like server.
Here is a sample of Transform’s SQL dialect (MQL):

SQL dialect in Transform
Cube.js’s SQL dialect looks closer to native SQL.

SQL dialect in Cube.js
Query generation
The queries generated by the metrics server need to be accurate and performant in the specific SQL dialect of the data warehouse it connects to. The Metrics server must also allow complex joins and other advanced computations like windowed aggregations, multi-fact metrics or multi-level aggregations.
Supporting different kinds of advanced metrics has become a hotly contested market with the vendors of Headless BI tools vying to best each other. In his recent blog post Amit Prakash of ThoughtSpot describes the current mood in the ecosystem as follows:
“…this is the most powerful iteration of a metrics layer. Most BI tools today differ heavily in what type of metrics they can or cannot support. There are also subtle differences in how they generate queries for different types of metrics. In an ideal scenario, the metrics layer will encapsulate query generation as well…”
Performance Tuning and Caching
Permalink to “Performance Tuning and Caching”Since Headless BI tools add an extra layer to the metrics computation process, they need to be designed with a specific focus on performance. This is achieved by:
- A built-in query tuner to optimize queries for the target data warehouse.
- Advanced features like HyperLogLog to help the tools walk the line between accuracy and performance.
- Caching of frequently queried metrics to speed up query results. Headless BI tools achieve this by a combination of caching in-memory and pre-aggregating commonly used metrics in a traditional database (MySQL, Postgres), a custom database (Cube’s Cubestore) or within the data warehouse itself.
Governance Layer
Permalink to “Governance Layer”The governance layer helps with metrics management. It manages metrics search and discovery, metadata, lineage, and notifications. It also controls user-level and organization-level access to metrics. The governance layer is also called a metrics catalog.
Here’s a screenshot from the metrics catalog page of Transform (courtesy Transform.co documentation)
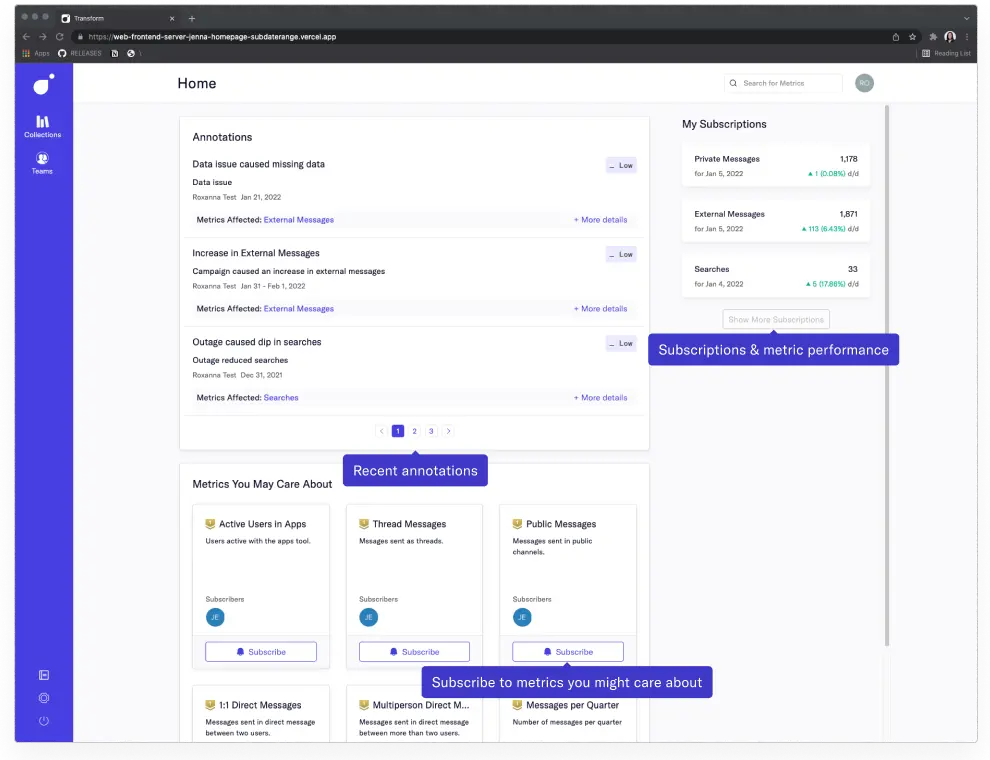
Transform's metrics catalog: A governance layer for metrics
At the time of writing this article, governance is still evolving across the ecosystem. Some tools offer out-of-the-box support for SSO integrations, version control, access control, and more. Others rely on open APIs to integrate with 3rd party governance tools.
Integrations
Permalink to “Integrations”Just like any other tool in the modern data stack, Headless BI tools facilitate a wide variety of integrations - both upstream and downstream. On the data warehouse side, Headless BI tools support all the popular data warehouses like Redshift, Bigquery, Snowflake, Databricks, and many more. On the metrics consumption side, they support integrations with well-known BI tools (thanks to the SQL API) as well as other operational and reverse ETL systems via the REST or GraphQL APIs.
As Headless BI tools grow in prominence, the demand for integration with the rest of the data stack like orchestration, governance, and data quality tools will likely increase.
Future of Headless BI
Permalink to “Future of Headless BI”A well-designed Headless BI tool ensures consistent metrics definitions and reporting. It actively promotes the metrics-as-code paradigm in which the metrics logic can be defined, version-controlled, validated, and deployed like any other code. It also makes space for the development of single-responsibility BI tools that can focus on richer visualization and better analytical storytelling without having to worry about metrics definitions or data modeling.
Besides all this, a Headless BI system must enable complex computations. It must offer a rich set of APIs that enable different systems in the stack to consume metrics on demand. It should effectively pose as an SQL server to the BI tools in the ecosystem. Additionally, it should offer strong governance features to help manage metrics discovery and usage. At the same time, it must have a small footprint, performance-wise. All this is a tall order.
The currently available Headless BI tools are in their early stages of evolution and have not yet been battle-tested on all counts. What we see today are their early attempts at delivering some or all of the above features and functionalities. They will probably get it wrong a couple of times before getting it right.
As for the future, it remains to be seen who would succeed in developing the most effective and comprehensive Headless BI solution. Will it be the existing BI tool vendors who already have a large customer base and a deeper understanding of the problem space? Or will it be vendors like Cube.js and Transform who are solely focused on building such systems? Or will the best solution come from a company like dbt Labs for whom the metrics layer would just be a logical extension to their already existing transformation tool?
Whichever is the case, we can be sure that a robust and effective Headless BI system will lead us toward exciting new ways of consuming metrics.
Headless BI: Related reads
Permalink to “Headless BI: Related reads”- The future of the modern data stack in 2024: Featuring the 6 big ideas you should know
- DataOps explained from scratch: Principles and its importance to modern data teams
- What is Data Mesh?
- What is modern data stack: history, components, platforms, and the future
- What is reverse ETL and how does it enhance the modern data stack?
Share this article

