Share this article
The Gartner Magic Quadrant for Data Quality evaluates vendors based on their ability to execute, innovation, market positioning and completeness of vision. It categorizes companies as Leaders, Visionaries, Challengers, or Niche Players.
This analysis helps organizations compare data quality tools, identify market trends, and select solutions that align with their goals.
See How Atlan Aligns with Gartner’s Data Governance Vision
Gartner’s comprehensive framework provides actionable insights to improve data governance, integration, and scalability.
The Magic Quadrant simplifies decision-making by offering a clear, data-driven evaluation of the market’s top performers and emerging technologies.
Gartner’s Inaugural Magic Quadrant for D&A Governance is Here #
In a post-ChatGPT world where AI is reshaping businesses, data governance has become a cornerstone of success. The inaugural report provides a detailed evaluation of top platforms and the key trends shaping data and AI governance.
Read the Magic Quadrant for D&A Governance
In today’s data-driven world, data quality is crucial to an organization’s success. However, the prevalence of data quality issues has been rising, leading to disruptions in operational efficiency.
That’s why Gartner developed the Gartner Magic Quadrant for Data Quality Solutions, a classification criterion for data quality tools. It assesses each tool’s strengths and weaknesses in vision and execution.
In this article, we’ll summarize how Gartner assesses data quality tools and the trends it sees in the market. We’ll also cover what you should look out for when evaluating data quality tools for purchase.
Table of contents #
- Gartner on the state of the data quality market
- Gartner Magic Quadrant for Data Quality Solutions: An overview
- Gartner on improving data quality
- How organizations making the most out of their data using Atlan
- Concluding thoughts
- FAQs about Gartner Magic Quadrant for Data Quality
- Related reads
Gartner on the state of the data quality market #
According to Gartner, data quality solutions are “the set of processes and technologies for identifying, understanding, preventing, escalating and correcting issues in data that supports effective decision making and governance across all business processes.”
Data quality tools are crucial in managing and ensuring data accuracy for many use cases. These use cases include analytics and data science, master data management, artificial intelligence, and machine learning.
See Atlan’s AI Governance & Quality Launch Live | RSVP Now
These data quality improvements lead to:
- Improved data quality
- More reliable insights
- Improved decision-making processes
- Improved workflows
Gartner Magic Quadrant for Data Quality Solutions: An overview #
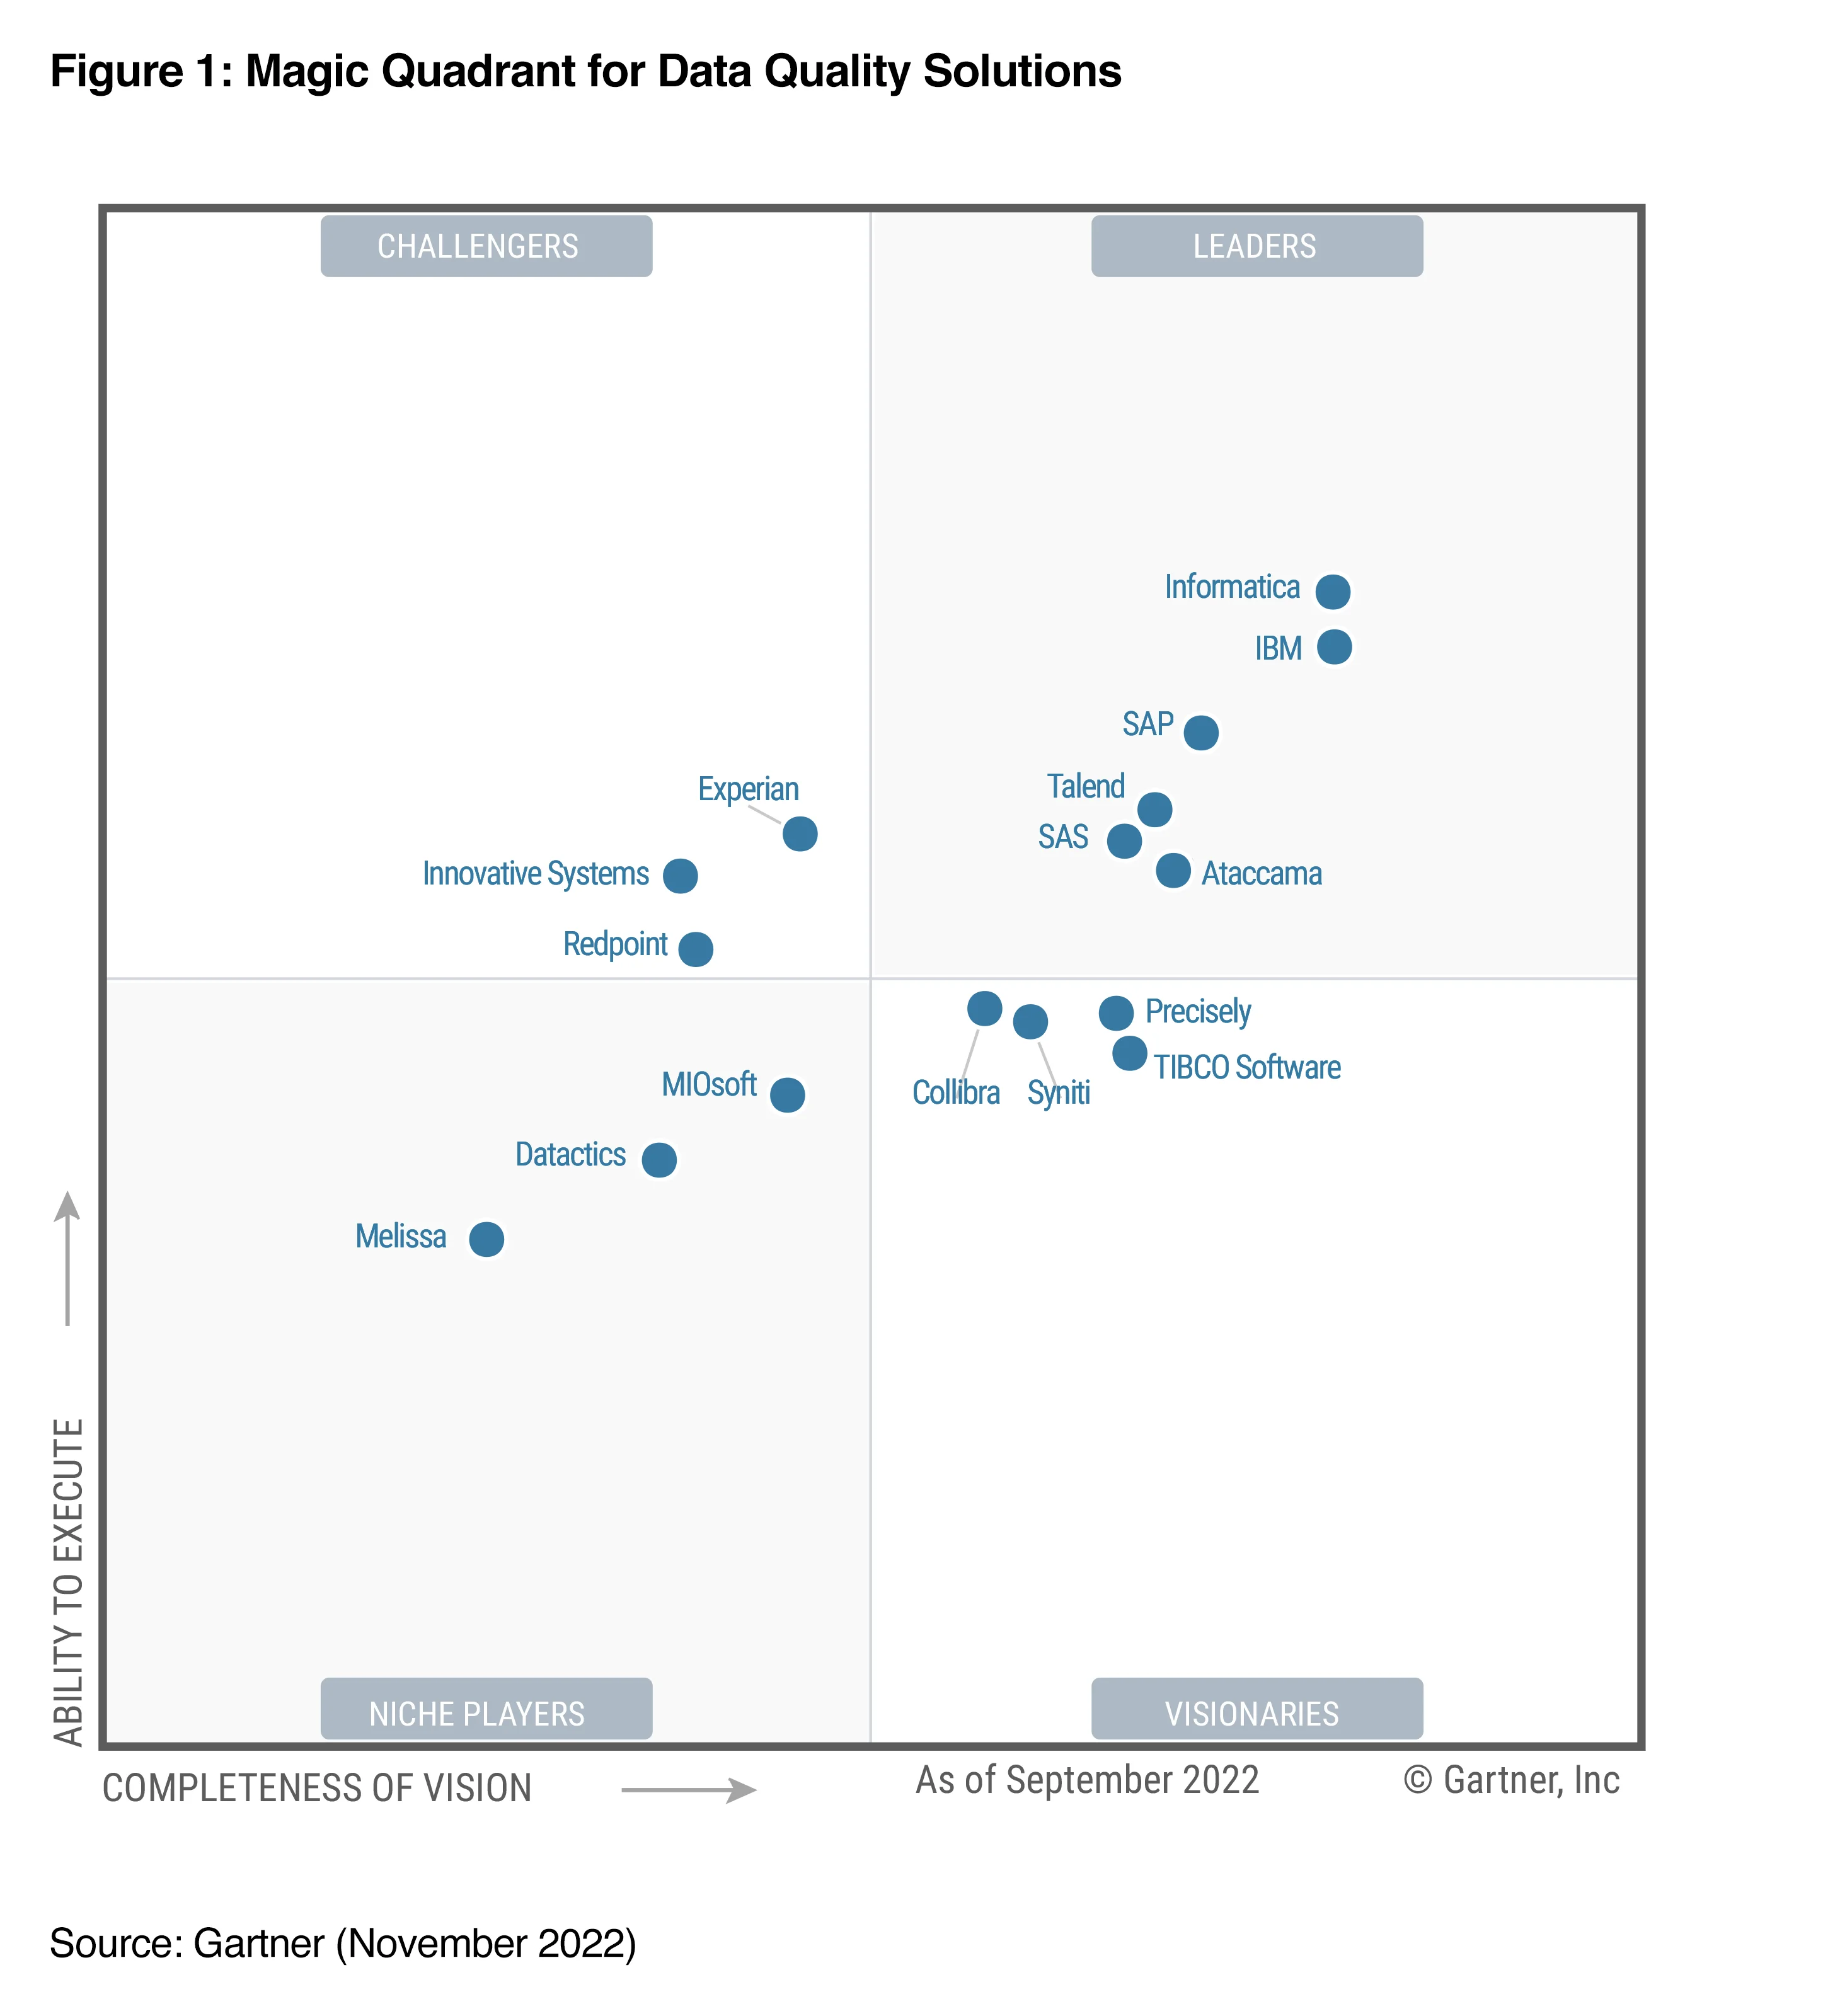
The Gartner Magic Quadrant for Data Quality Solutions - Source: Gartner.
The Gartner Magic Quadrant for Data Quality Solutions is a graphical representation of the rankings of a number of data quality tools.
In general, Magic Quadrants evaluate the various platforms available in the market. According to Gartner, a Magic Quadrant is “a snapshot in time that assesses the vendors’ vision and Ability to Execute.”
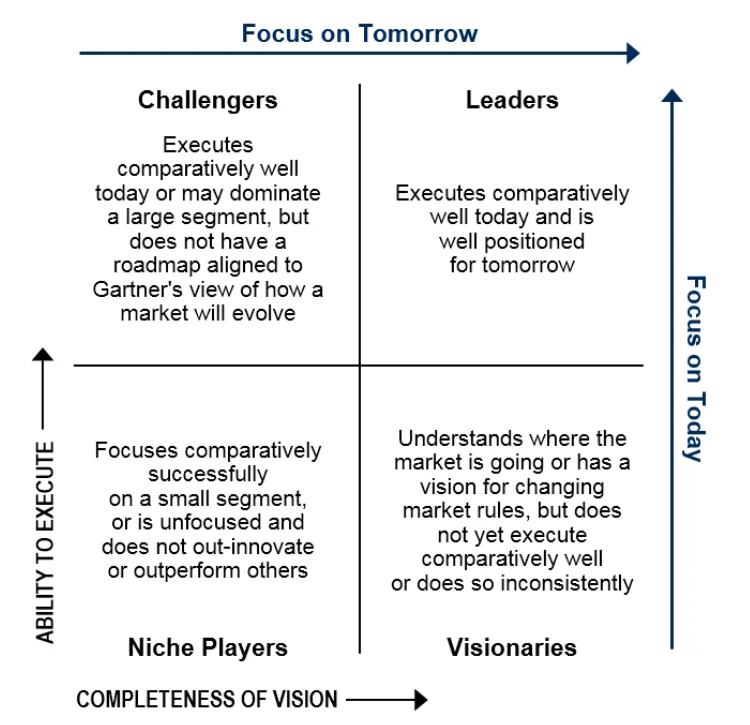
The Magic Quadrant is a snapshot in time of a vendor’s vision and the ability to execute - Source: Gartner.
Gartner determines their rankings based on the tool’s vision, market understanding, and demonstrated ability to execute.
Here are the four quadrants and what they stand for:
- Leader: Exhibits all of the essential qualities required for the platform to rank.
- Challenger: Has shown the ability to execute but lacks a clear vision of their future and market understanding.
- Visionary: Has a clear vision of the current market but has not demonstrated its ability to execute
- Niche Player: Focuses on a sub-section of the market but has an unclear vision and a lack of demonstrated execution.
These quadrants provide valuable insights into the alignment between a tool’s future aspirations, understanding of its market, and its proven track record.
Gartner Magic Quadrant for Data Quality Solutions: Essential capabilities #
According to Gartner, a core capability of data quality solutions is augmented data quality (ADQ). The platform employs advanced techniques such as metadata analytics, knowledge graphs, and artificial intelligence to automate labor-intensive repetitive or manual data quality processes.
For example, you can establish statistical processes to identify a range of numeric values to flag when the incoming values are out of bounds. This workflow streamlines quality workflows and minimizes the possibility of human error.
Gartner highlights augmented data quality as a key market driver. Other essential capabilities include:
- Connectivity with a wide range of data sources
- Comprehensive profiling to give business users insight into the quality of data and empower them to identify data quality issues
- Interactive visualization and analytics to help business and IT users identify, understand, and monitor data quality issues and discover patterns and trends
- Monitoring based on preconfigured, custom-built monitoring rules, or adaptive rules, and alert violations
- Auto-detection of outliers, anomalies, patterns, and drifts
- Parsing, standardizing, and cleansing capabilities
- Matching, linking, and merging of data entries across your data estate
- Metadata discovery and collection to support lineage, root cause analysis, data discovery, cataloging, and more
- Multidomain support
- Data curation and enrichment to improve completeness and add value.
- Rule management and data validation
- Business-driven workflow and issue resolution in a collaborative manner
- DataOps support to improve the communication, integration, and automation of data flows between data managers and data consumers across an organization
- Deployment environment
- Architecture and integration
- Automation and augmentation by leveraging advanced technologies such as AI/ML, knowledge graph, active metadata, or NLP to minimize manual effort
- Multi-person usability to engage and support the various roles (especially nontechnical business roles)
Next, let’s look at Gartner’s inclusion criteria for the Magic Quadrant for Data Quality Solutions.
Gartner Magic Quadrant for Data Quality Solutions: Inclusion criteria #
To qualify for inclusion, Gartner specifies the following inclusion criteria:
- Offers a stand-alone data quality solution
- Delivers critical data quality functions, such as data profiling, monitoring and detection, rule management and data validation, and parsing, among others
- Supports augmentation of the critical data quality functions
- Enables large-scale deployment, along with support for the cloud-based/SaaS versions
- Supports multiple data domains and diverse use cases across different industries
- Maintains an installed base of at least 100 production paying customers (different companies/organizational entities); alternatively, makes at least $5 million in total recognized revenue for software (license, maintenance, and subscription and not any services)
- Includes customers in multiple countries and in at least two of these regions — North America, South America, EMEA, and Asia/Pacific
- Supports data quality functionality with packaged capabilities to process data in at least two different languages
- Includes a complete solution for four or more of the following types of users — data steward, data architect, data quality analyst, data engineer, data integration analyst, data scientist, business intelligence analyst, and a casual user
- Provides out-of-box (OOTB) and prebuilt data quality rules for data profiling and monitoring, cleansing, standardization, and transformation
- Supports integrability and interoperability with other data management solutions
- Offers direct sales and support operations, or a partner providing sales and support operations in at least two of the following regions — North America, South America, EMEA and Asia/Pacific
Gartner Magic Quadrant for Data Quality Solutions: Ranking criteria #
As mentioned earlier, Gartner looks at the Ability to Execute by considering the following criteria:
- Product or service capabilities, quality, feature sets, skills, and more; solutions are rated based on their ability to address current market needs
- Overall viability that shows the likelihood of a vendor continuing to offer and invest in the product
- Sales execution/pricing methods — deal management, pricing and negotiation, presales support, and the overall effectiveness of the sales channel (direct and indirect sales)
- Market responsiveness/record demonstrating the vendor’s ability to respond, change direction, be flexible, capitalize on opportunities, and adapt as needs evolve or market dynamics change
- Marketing execution that uses messaging capable of influencing the market, boosting brand awareness, and cultivating a positive brand image
- Customer experience and the level of satisfaction they express
- Operations in terms of the quality of the organizational structure, skills, experiences, programs, the stability of key staff, and more
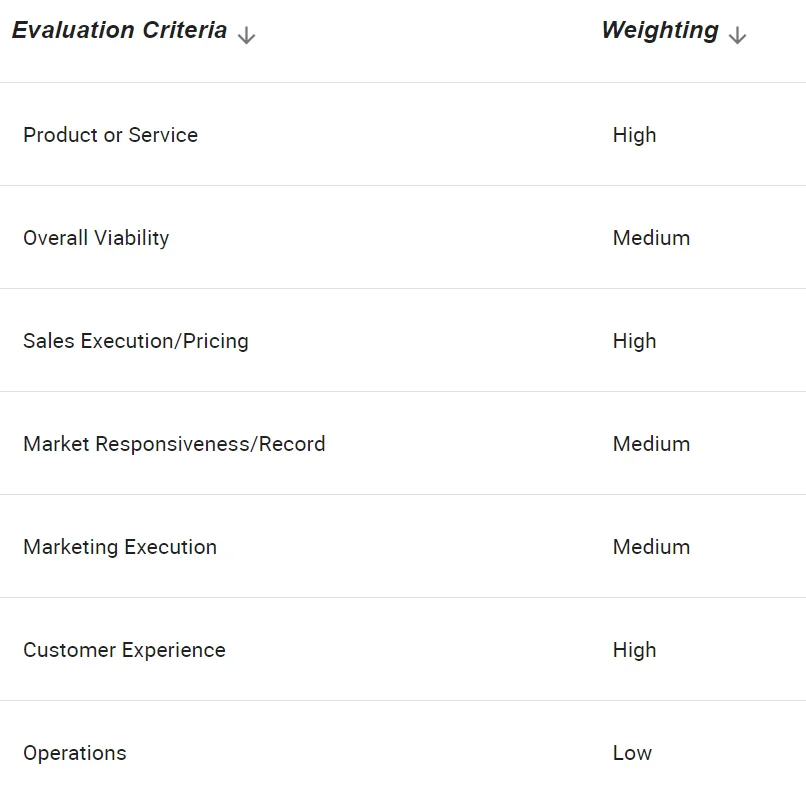
Gartner Magic Quadrant for Data Quality Solutions evaluation criteria - Source: Gartner.
Gartner on improving data quality #
Gartner also defines a data quality maturity scale. Organizations can determine the level of data quality maturity they have attained and identify the next steps to enhance their data quality practices.
Gartner’s Data Quality Maturity scale defines Low, Medium, and High Data Quality as the following:
- Low Quality: An organization’s actions are restricted to defining the impact of data quality improvements on business outcomes via KPIs and establishing data quality standards.
- Medium Quality: An organization prioritizes data quality. They set up and utilize dashboards and reporting to track data quality metrics and establish data quality responsibilities.
- High Quality: An organization integrates data quality throughout its processes.
Once you’ve assessed the current standing of your data quality, you can take the necessary steps to improve it. These may include:
- Defining clear data governance policies
- Defining data standardization standards and data cleansing processes
- Monitoring data quality
- Training users on the importance of data quality and the processes necessary to achieve it
How organizations making the most out of their data using Atlan #
The recently published Forrester Wave report compared all the major enterprise data catalogs and positioned Atlan as the market leader ahead of all others. The comparison was based on 24 different aspects of cataloging, broadly across the following three criteria:
- Automatic cataloging of the entire technology, data, and AI ecosystem
- Enabling the data ecosystem AI and automation first
- Prioritizing data democratization and self-service
These criteria made Atlan the ideal choice for a major audio content platform, where the data ecosystem was centered around Snowflake. The platform sought a “one-stop shop for governance and discovery,” and Atlan played a crucial role in ensuring their data was “understandable, reliable, high-quality, and discoverable.”
For another organization, Aliaxis, which also uses Snowflake as their core data platform, Atlan served as “a bridge” between various tools and technologies across the data ecosystem. With its organization-wide business glossary, Atlan became the go-to platform for finding, accessing, and using data. It also significantly reduced the time spent by data engineers and analysts on pipeline debugging and troubleshooting.
A key goal of Atlan is to help organizations maximize the use of their data for AI use cases. As generative AI capabilities have advanced in recent years, organizations can now do more with both structured and unstructured data—provided it is discoverable and trustworthy, or in other words, AI-ready.
Tide’s Story of GDPR Compliance: Embedding Privacy into Automated Processes #
- Tide, a UK-based digital bank with nearly 500,000 small business customers, sought to improve their compliance with GDPR’s Right to Erasure, commonly known as the “Right to be forgotten”.
- After adopting Atlan as their metadata platform, Tide’s data and legal teams collaborated to define personally identifiable information in order to propagate those definitions and tags across their data estate.
- Tide used Atlan Playbooks (rule-based bulk automations) to automatically identify, tag, and secure personal data, turning a 50-day manual process into mere hours of work.
Book your personalized demo today to find out how Atlan can help your organization in establishing and scaling data governance programs.
Concluding thoughts: Build data quality into your data projects #
Gartner predicts that by 2024, 90% of data quality technology buying decisions will focus on ease of use, automation, operational efficiency, and interoperability as critical decision factors.
Data quality is vital in facilitating quality decision-making and is crucial to effective data governance practices.
Organizations can build and incorporate data quality standards and processes into their organizational culture regardless of the data stack used.
Regardless of the toolset, every organization can revamp its data quality guidelines and processes. The road to good data quality, as always, starts with people.
FAQs about Gartner Magic Quadrant for Data Quality #
1. What is the Gartner Magic Quadrant for Data Quality? #
The Gartner Magic Quadrant for Data Quality is a research report that evaluates and positions data quality tools based on their completeness of vision and ability to execute. It provides a comparative analysis to help organizations select the right data quality solutions for their needs.
2. Who are the leaders in the Gartner Magic Quadrant for Data Quality? #
Leaders in the Gartner Magic Quadrant for Data Quality are vendors that demonstrate a strong vision and the ability to execute it effectively. These companies offer comprehensive data quality tools and have a significant market presence.
3. How does Gartner evaluate data quality tools? #
Gartner evaluates data quality tools using two main criteria: completeness of vision and ability to execute. Completeness of vision assesses a vendor’s innovation and market understanding, while ability to execute focuses on product performance, customer experience, and overall business viability.
4. What are the benefits of using a Magic Quadrant evaluation? #
Using a Magic Quadrant evaluation helps organizations objectively compare vendors, understand market dynamics, and identify solutions that align with their business goals. It simplifies the decision-making process by providing a clear visual representation of vendor strengths and weaknesses.
5. How can I choose the right data quality tool based on the Magic Quadrant? #
To choose the right data quality tool, consider your organization’s specific needs and priorities, then compare vendors within the relevant quadrant. Leaders are often suitable for comprehensive needs, while niche players may offer specialized capabilities.
6. What trends are influencing the data quality market in 2025? #
In 2025, trends such as increased adoption of AI-driven data quality tools, automation of data processes, and a growing emphasis on real-time data quality monitoring are shaping the market. These trends address the rising demand for efficient, scalable, and accurate data management solutions.
Gartner Magic Quadrant for Data Quality: Related reads #
- What is Data Governance? Its Importance, Principles & How to Get Started?
- How to implement data governance? Steps, Prerequisites, Essential Factors & Business Case
- 7 Best Practices for Data Governance to Follow in 2025
- Automated Data Governance: How Does It Help You Manage Access, Security & More at Scale?
- Data Governance vs. Data Management: What’s the Difference?
- How to Improve Data Governance? Steps, Tips & Template
- 7 Steps to Simplify Data Governance for Your Entire Organization
- Data Governance Framework — Guide, Examples, Template
- McKinsey Data Governance Framework: 5 Steps to Use It
- Data Governance Tools: Importance, Key Capabilities, Trends, and Deployment Options
- Data Governance Tools Comparison: How to Select the Best
- Data Governance Tools Cost: What’s The Actual Price?
- Data Governance Process: Why Your Business Can’t Succeed Without It
- Data Governance and Compliance: Act of Checks & Balances
- Data Governance vs Data Compliance: Nah, They Aren’t The Same!
- Data Compliance Management: Concept, Components, Getting Started
- Data Governance for AI: Challenges & Best Practices
- A Guide to Gartner Data Governance Research: Market Guides, Hype Cycles, and Peer Reviews
- Gartner Data Governance Maturity Model: What It Is, How It Works
- Data Governance Roles and Responsibilities: A Round-Up
- Data Governance in Banking: Benefits, Implementation, Challenges, and Best Practices
- Data Governance Maturity Model: A Roadmap to Optimizing Your Data Initiatives and Driving Business Value
- Open Source Data Governance - 7 Best Tools to Consider in 2025
- Federated Data Governance: Principles, Benefits, Setup
- Data Governance Committee 101: When Do You Need One?
- Data Governance for Healthcare: Challenges, Benefits, Core Capabilities, and Implementation
- Data Governance in Hospitality: Challenges, Benefits, Core Capabilities, and Implementation
- 10 Steps to Achieve HIPAA Compliance With Data Governance
- Snowflake Data Governance — Features, Frameworks & Best practices
- Data Governance Policy: Examples, Templates & How to Write One
- 7 Best Practices for Data Governance to Follow in 2025
- Benefits of Data Governance: 4 Ways It Helps Build Great Data Teams
- Key Objectives of Data Governance: How Should You Think About Them?
- The 3 Principles of Data Governance: Pillars of a Modern Data Culture
Share this article


